Lazy people do it better

We are usually habit, sometimes, to react to some events with predefined actions
If we increase the traffic then we increase the resources
That is true and in some scenario is still the procedure , however i think we need to better understand what we have behind and the goal that we want to reach.
Since I'm lazy i prefer to work one time , rather than be event driven
First of all the KPI
This is not only related if the service is up and down , or if it's degraded or not ... is mostly focused on the service expectation
Answer in 3ms ?
Answer in 30ms ?
Answer in 300ms ?
Answer in 3000ms ?
In all the above question the service is running but the impact can be really different
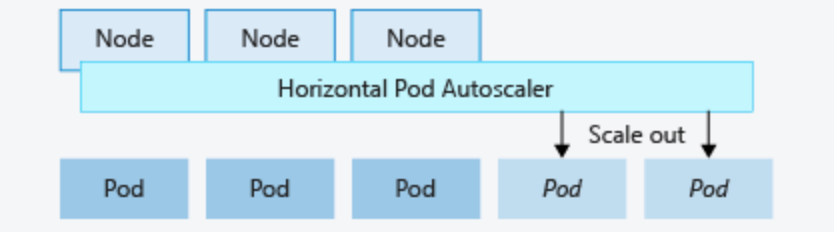
So let's talk a bit about ONE of the possible infrastructure helpful trick ... the autoscaling.
This concept is already present since some years , aws has embraced it as first with the autoscaling solution for ec2 instances , now (since few years) kubernetes as introduced the HPA
How can help ?
There are many answer , but it's better to test with a lab some of those
Environment settings
Imagine an application that is managing a service
In this example is a python api that answer for a fibonacci serie
$ curl -i https://oracolo.k8s.it/api/fiHTTP/1.1 200 OKDate: Mon, 21 Feb 2022 15:18:50 GMTContent-Type: text/html; charset=utf-8Content-Length: 21Connection: keep-alive354224848179261915075
The idea was to have a function to slowdown the requests with the increase of cpu usage but to have a response time within 300ms (the KPI)
The application is installed on kubernetes with the following deployment
apiVersion: apps/v1kind: Deploymentmetadata: labels: app: pytbak track: pytbak-stable name: pytbak-stable namespace: pytbakspec: minReadySeconds: 10 replicas: 3 revisionHistoryLimit: 5 selector: matchLabels: app: pytbak track: pytbak-stable strategy: rollingUpdate: maxSurge: 50% maxUnavailable: 0 type: RollingUpdate template: metadata: annotations: prometheus.io/scrape: "true" prometheus.io/path: "/metrics" prometheus.io/port: "5000" labels: app: pytbak track: pytbak-stable spec: containers: - name: pytbak image: lgirardi/rest-test-multip:0.3 resources: limits: cpu: 300m memory: 250Mi requests: cpu: 30m memory: 125Mi ports: - name: http containerPort: 5000 livenessProbe: httpGet: path: /api/ port: 5000 initialDelaySeconds: 40 timeoutSeconds: 10 readinessProbe: httpGet: path: /api/ port: 5000 initialDelaySeconds: 5 timeoutSeconds: 15
Now we have how 3 pods ready to handle requests
In an unrealistic use cases we have a constant usage, instead in the real world, the usage is impacted by peak of traffic, scrapes , new feature , promotion , regional distribution etc etc
I know , it's a stretch using this gatling configuration but it's useful to share the idea setUp( scn.inject( nothingFor(1.seconds), // do nothing for 1 sec atOnceUsers(1), // have 1 call for 1 sec rampUsers(10).during(20.seconds), // increase users to 10 in 20 sec constantUsersPerSec(10).during(15.seconds), // keep 10 users for 15 sec rampUsersPerSec(10).to(100).during(3.minutes), // increase users to 100 in 3 min constantUsersPerSec(100).during(60.seconds), // keep 100 users for 1 min rampUsersPerSec(100).to(10).during(3.minutes).randomized, // decrease users to 10 in 3 min constantUsersPerSec(10).during(30.seconds), // keep 10 users for 30 sec rampUsersPerSec(10).to(1).during(10.seconds).randomized, // decrease users to 1 in 10 sec ).protocols(httpProtocol))
and the url tested was
$ curl -i https://oracolo.k8s.it/api/fib/18500
HTTP/1.1 200 OK
Date: Mon, 21 Feb 2022 15:46:02 GMT
Content-Type: text/html; charset=utf-8
Content-Length: 3866
Connection: keep-alive
Vary: Accept-Encoding
83533296884435624867798531585140565339442079861725087204086868538470047335735
43822749284012562109156072993926836560850582712240843325537682043365082110610
74026311291800113704704348249392230730803891751617970900168446982968243007736
51197815341736702893065750384164322487072420946350671608236528336490734320752
15766217894062662319153446190938791478882600888720832141034382665639025753273
30750839228343101989644891936468903562404233796143208624300662188211844387971
12866863645098425877607285194374927111578752851305578221078133055618856142572
55524813028556809618441843877627693663784558866751538817238272015121741425393
99049964805007884503362484550579798684692431918631521197439158243117538949606
37155643851292040158395873383975165892212817619455430033494636143410239812404
80529547905260319321739870888187908535609149526797446231747889061304445725815
63419312476001987112390317255585462630499726624943926108760315984710835726791
64604969656765499209392211865567181332414241748115992393468455078857640503788
18491664670055330318299320987588212834680593778419314796246160245694639311623
45963069508719454819599551852953998681323163667721305365938646262462463653426
03120490907728272394316733945290936238595191234306195169403527451189150944412
55734943613733388177050741716869683215360508942821849631632473401081464418614
88129911023030514034348960453039999292198017445266482693060747698164480133895
42107812053775651030682262614149238225324860891787622323532546655762387576106
16744230275914963410655344193109686235699009316258222627309839038398946965798
93288112545157969932414111834814316569339369657297666636164718674805983154767
82716375582052616490320939205226143196168442740492338964903461454065891061788
24914385318462704330186677169214346572575320087900214462474550701206183564981
67940149169727266071833671192220852019181820327868422609361307508447137372952
70741193765954124906216947802897539084895498757041969867186546875822187085826
51268178561205184593600199506688874949513005414185093510082888499893907289670
60694081358868925846231023994576416351401218579760341994807107707262673164628
93989847554183605689726587752375584972993275839904589589079161246680599376961
46522822317563050982509757869699803683290147662057482039180565933217050406411
63613334575670225316495894808773628497941926683531555239853003061300649659051
80663038779126115354211249859182852080094185399771594786495630198172605116654
36484876158120241561970086240965134946001448112627411711997627120355963199768
37453968472163446367339200530252903452374910026941922776248397460043788137117
03792457930019057411962758264853807991677322585740303176087173311737493675814
97785846553584211669490948369627378763409533632607628189347167959335358534179
14936021275618379596024302703059923780925579890415606776752696469049010540674
16762272554571834669670185083416940001269702457012387259986804993721400659735
98402981836433913009273334871164379864504944274151763420867965690836123620164
71052527907012070090155568723470808988725230762895495242080853258248938503812
92377624996414841905746084025711457998759036082766019389458672225594149040894
25339957409692717694606288768279530280880496597818894383696651292555863738105
42519877809534106427059668587274469061728503718737115492047330320710617418343
36509845478020766819148991938613184822854393146963871218131954000091828603844
30710696936075943284582450858926759953941330918016364297470882233548644972398
02671169604082172661201779291650562320255581897779891571992387794168420428875
01665380594740126434308738080451514239759906771130514871814286159379595046723
96787175930658277115296525324844486906484486308261475140105238542837827794788
42270482292915032600476652997028797988664978676168344677300636439380532376130
50531301554510586963399762243280359072814214224506146343965459717217720978975
50897175029897270621313926837122497590225684346650930922871186632985491270868
6598493717570125
Results
fixed pods number
... what happened ?
Gatling results: https://lorenzogirardi.github.io/gatling-k8s-fixed-3-pods/
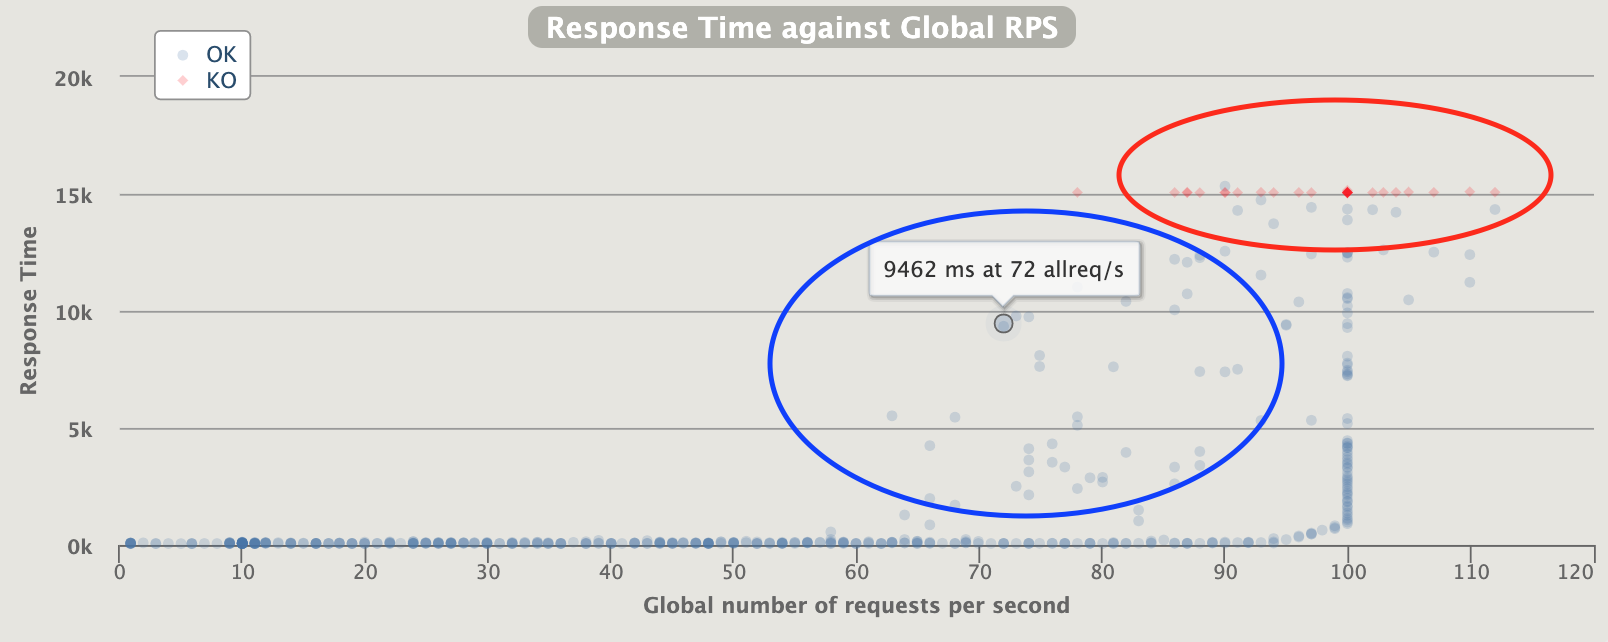
Big cluster of huge response time
Closing to 100 rps , service unavailable
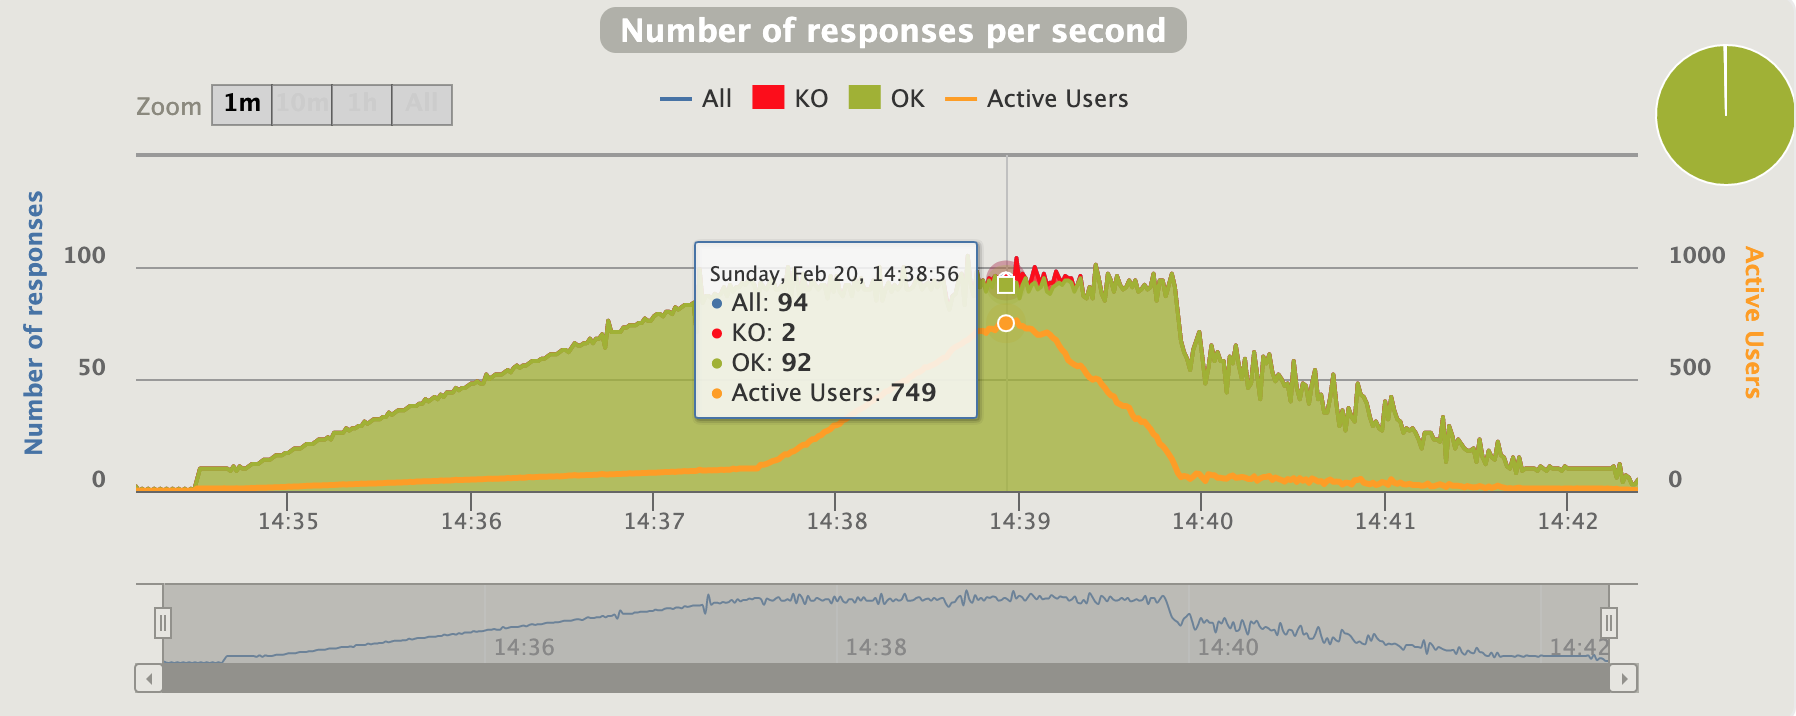
huge active users ... more than the requests (slowdown ... queue.... failures)
And the application status ?
Well now we know we know a bit our application ... we know the critical point but also that the KPI went to hell , high cpu and some pod crash
dynamic pods number
... what happened ?
Gatling results: https://lorenzogirardi.github.io/gatling-k8s-hpa/
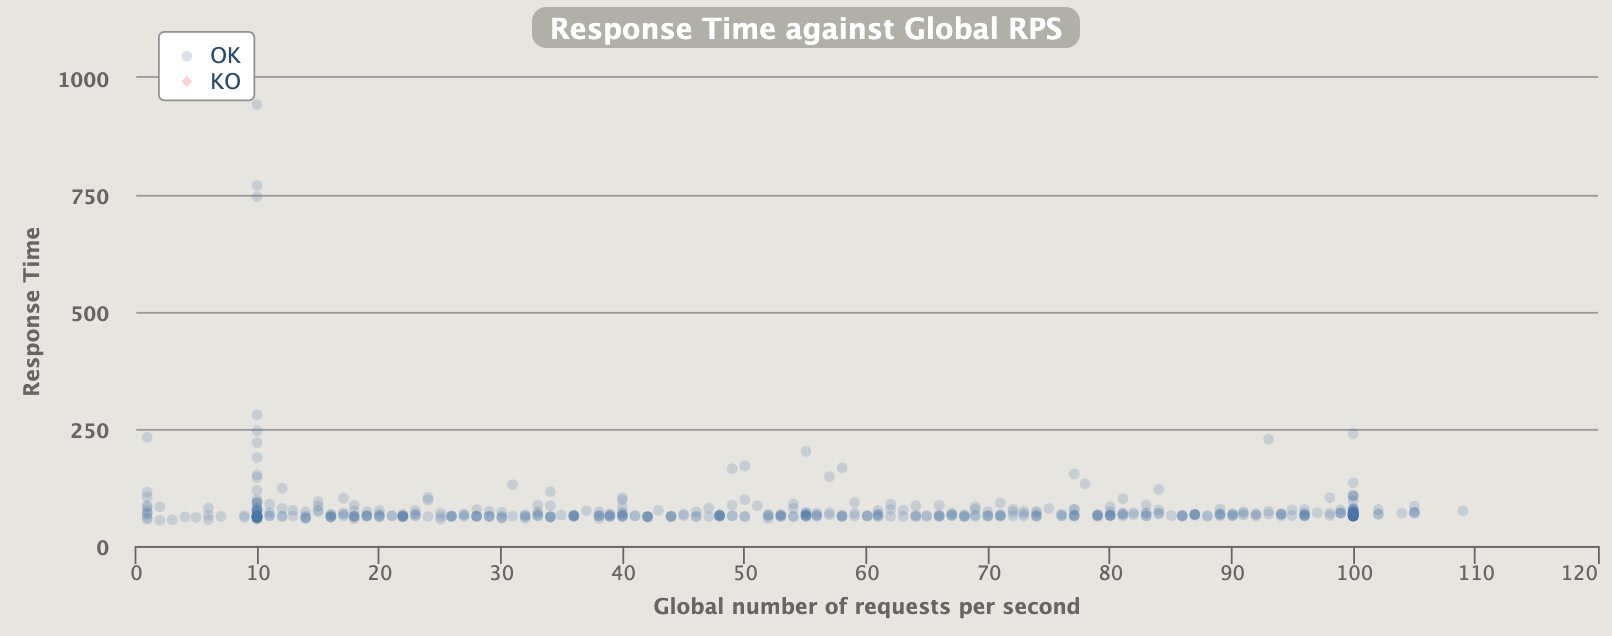
Some sporadic request over 300ms but 99% below
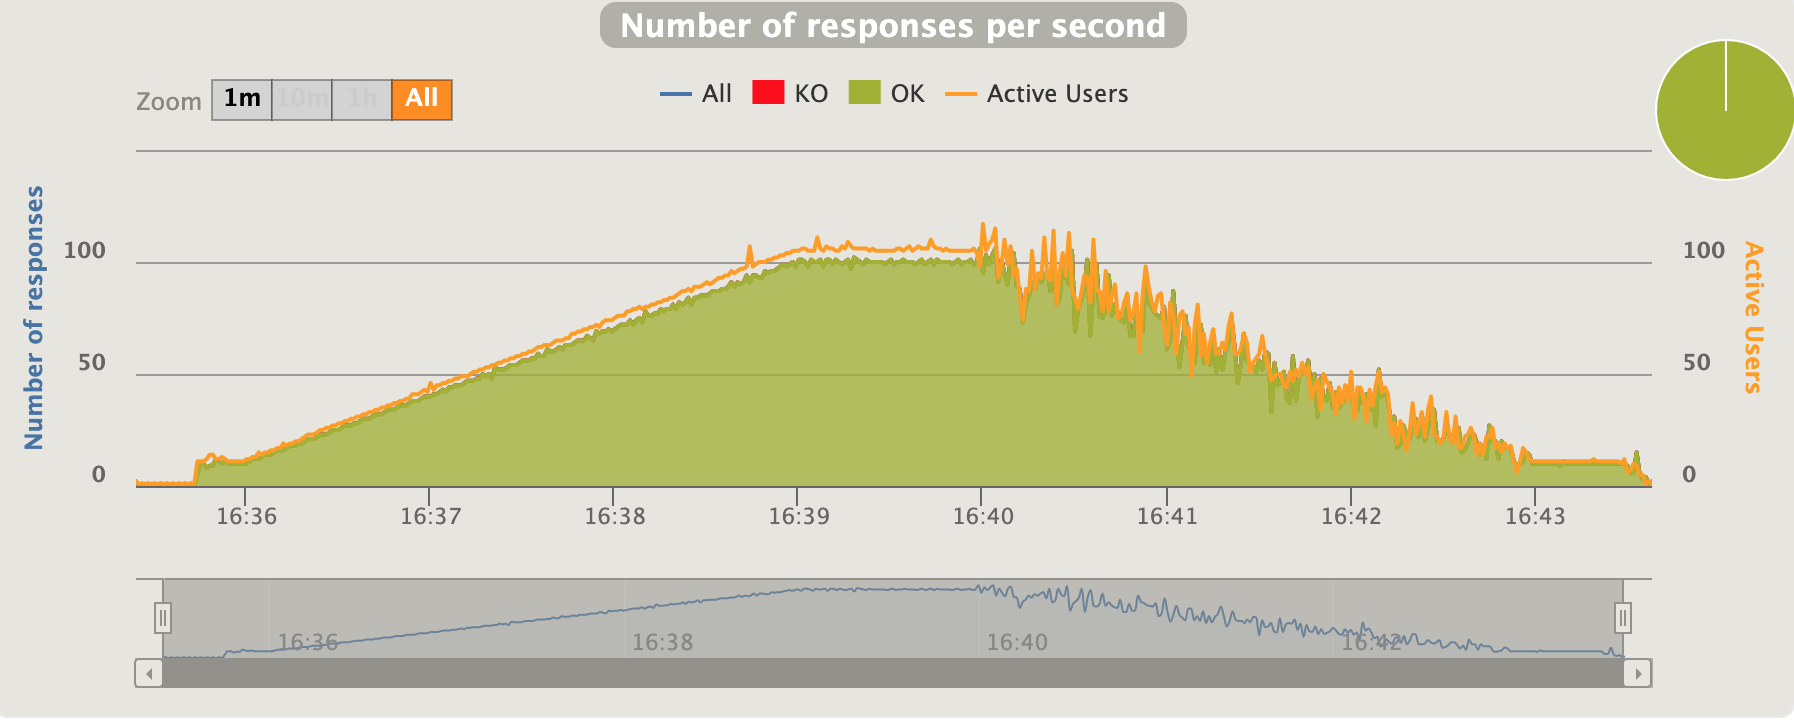
active users inline with the requests
And the application status ?
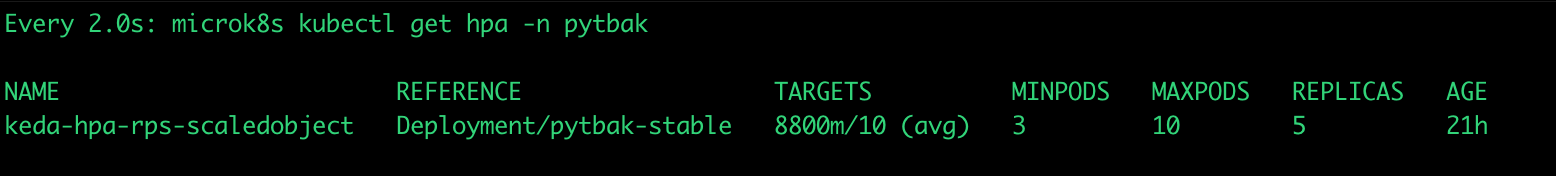
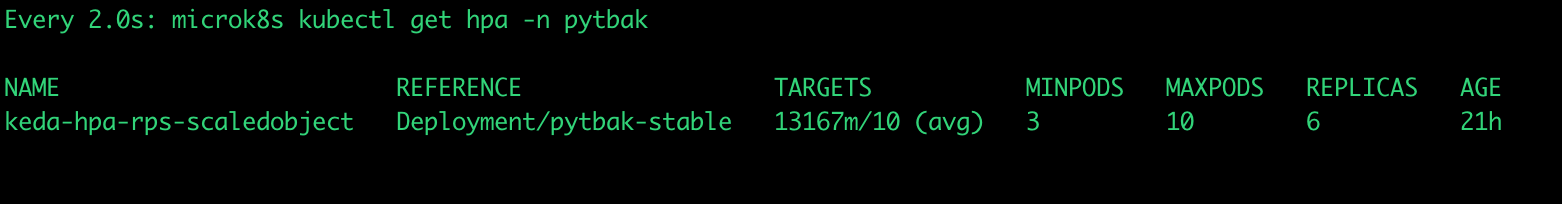
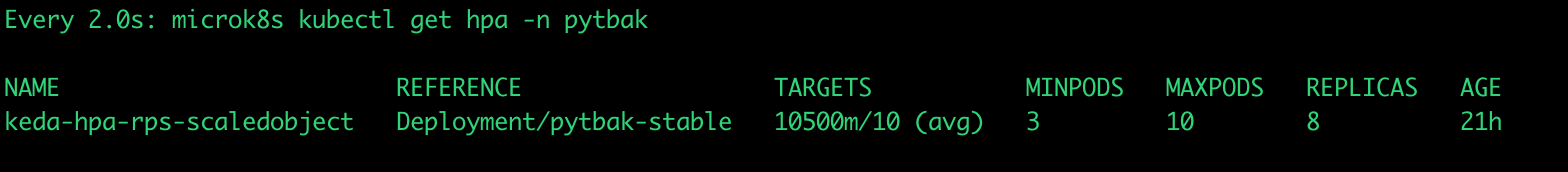
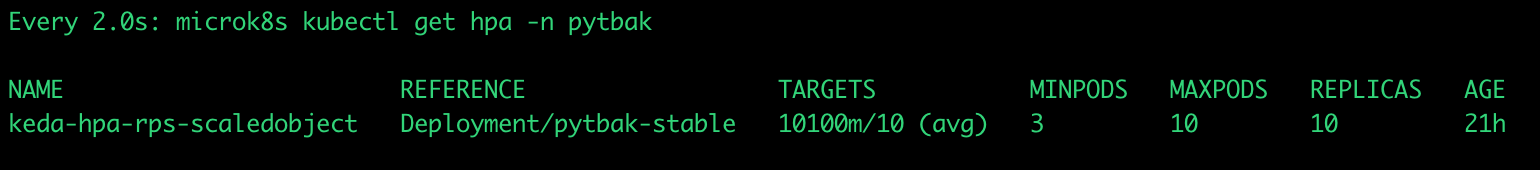
cpu under control , response time ok , no crash and autoscaled from 3 to 10 pods
HPA in pills
There are many how to and suggestions that explain this topic,
however what you need is:
- prometheus
- kpi and application tolerance knowhow
- keda.sh (i really hate the prometheus adapter)
Let's skip prometheus and go directly to kpi, application tolerance and keda.sh
When i create the fibonacci code , i was able to test the impact on cpu and response time , having the fibonacci as 18500
- the max pod tolerance to be running without error was 30rps
- to be within 300ms 15rps
I know, is not real life scenario but the concept is the same ... just identify the correct rps in a case where this value can be a trigger for the autoscaling
In the python app is flask_http_request_duration_seconds_count
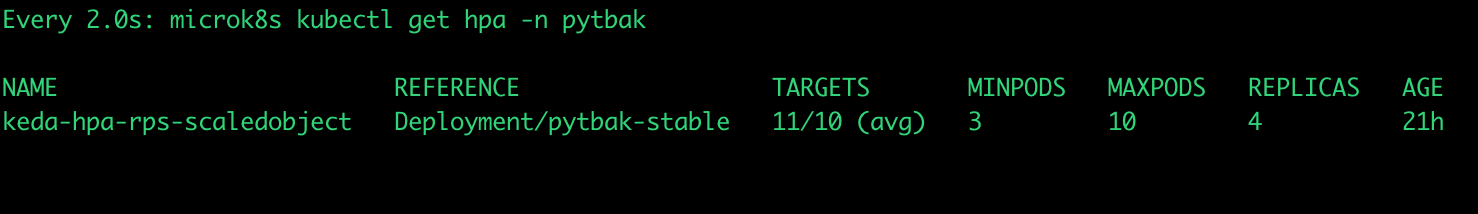
the following configuration for keda use this value as a trigger
apiVersion: keda.sh/v1alpha1
kind: ScaledObject
metadata:
  name: rps-scaledobject
  namespace: pytbak
spec:
  minReplicaCount: 3
  maxReplicaCount: 10
  pollingInterval: 10  # Optional. Default: 30 seconds
  scaleTargetRef:
    name: pytbak-stable
  advanced:                                          # Optional. Section to specify advanced options
    horizontalPodAutoscalerConfig:                   # Optional. Section to specify HPA related options
      behavior:                                      # Optional. Use to modify HPA's scaling behavior
        scaleDown:
          stabilizationWindowSeconds: 45 #option from kubernetes hpa to force pod shutdown in 45 dec , default 5 min
  triggers:
  - type: prometheus
    metadata:
    # Required fields:
      serverAddress: http://10.152.183.99:9090 # prometheus server
      metricName: flask_http_request_duration_seconds_count # Note: name to identify the metric
      query: sum(rate(flask_http_request_duration_seconds_count{status="200"}[60s])) # Note: query must return a vector/scalar single element response
      threshold: '10'
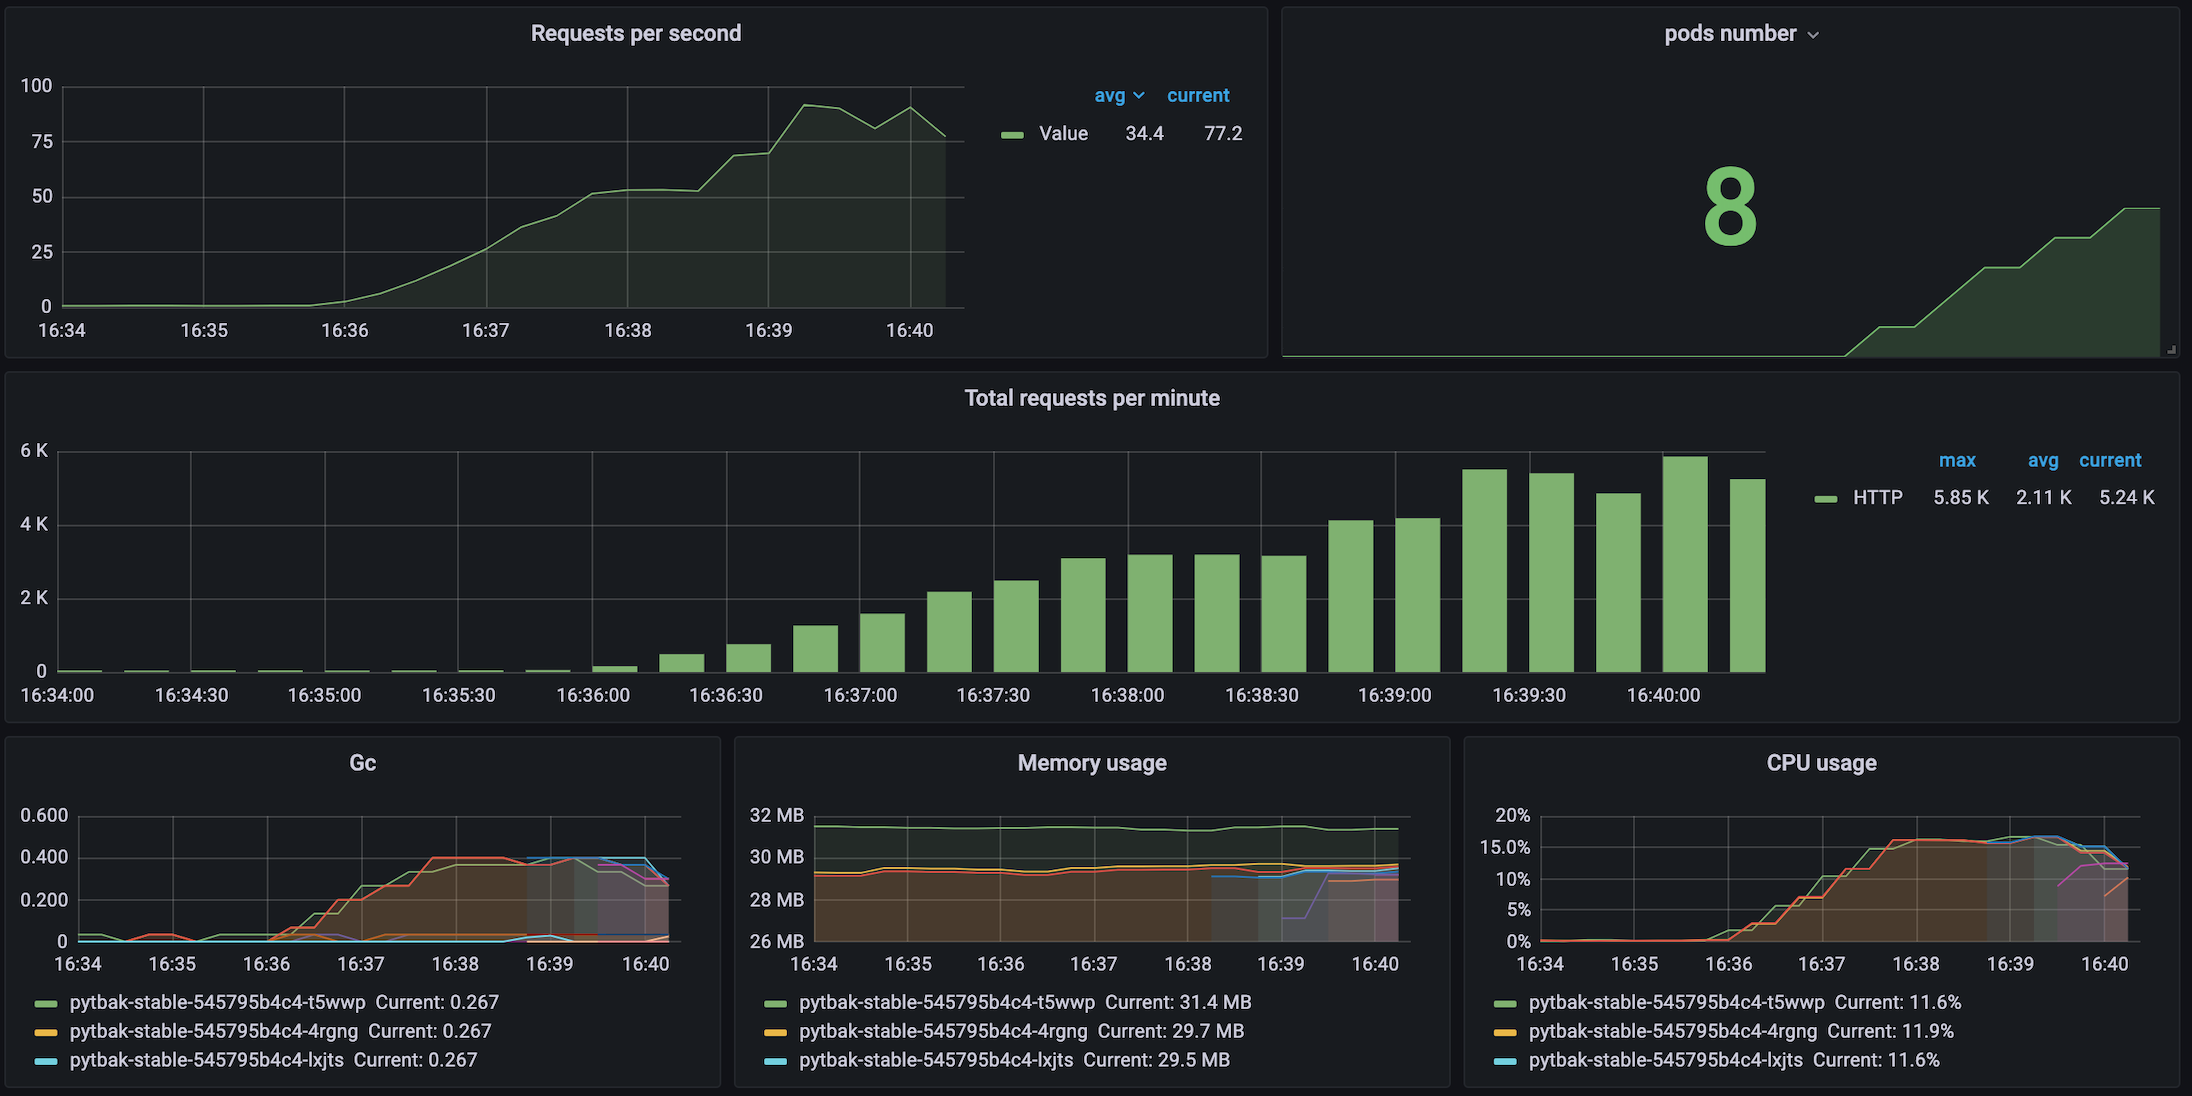
An this is what happened during the gatling test with hpa
Conclusions
HPA is an amazing solution not only in cloud there this feature is mandatory if you want to use the cloud in the right way and if you would like to remove overspending
but anyway...
It's the right model for lazy people in order to have a dynamic infrastructure to support the traffic, to reduce the monitoring and alerting alarms and be ready to scale :)