Kubernetes-nstats
Here we go ... another weird sidecar container
Motivations
I've always been interested in the observability area , there are many aspect that improve performances and fix bugs
One of the most interested aspect is te network usage.
This is not related to "network issue"

It's related to the usages
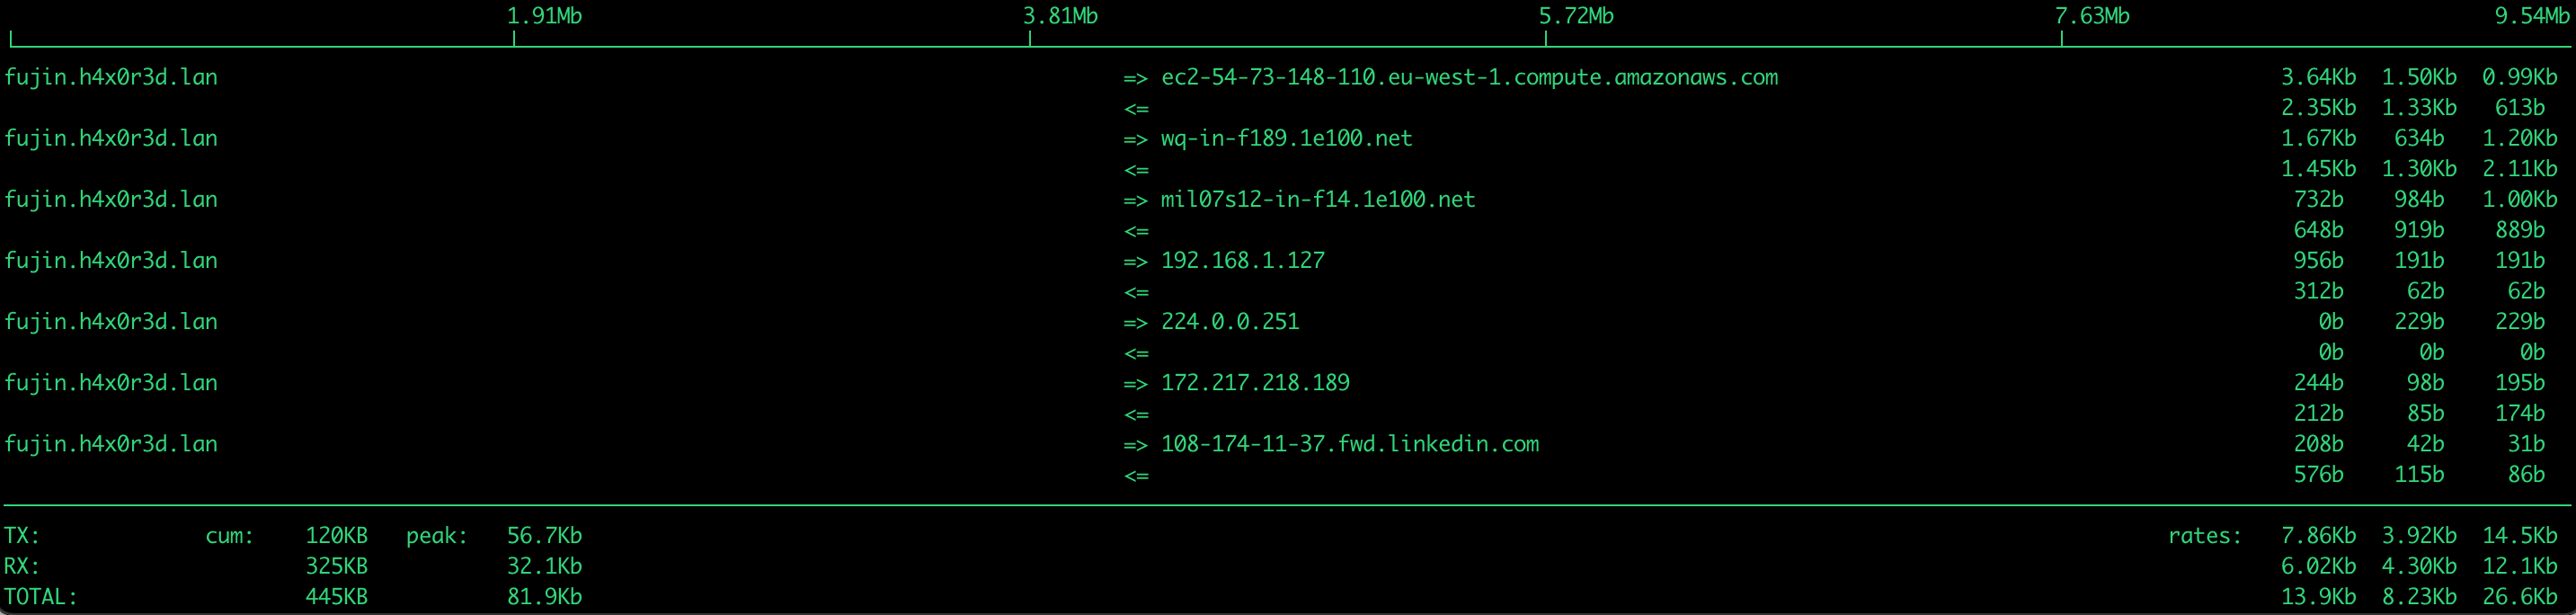
You are probably habit to see something like this for your vms
That is showing the traditional IN and OUT

An now ... with kubernetes you can have the same related to your pod
And again you have the IN and OUT

But where this bandwidth is be used ?
Answer is not easy , i mean
- you can profile the application
- you can profile the vm/pod
- you can have a dedicated APM
- you can have installed a service mesh
Service mesh is a good tool but for the reasons explained in the link ... you should promote it in the right way ... it's able to cover my question but let's assume it's a overengineering for my porpose.
APM ... well it depends on your company/money capability
What is missing ?
Well even if we are in 2021 i'm habit to use iftop to understand the usage , the limit is that is working in rountime and i miss a long vision term.

GOALs
- Monitor a kubernetes pod network with a sidecar container
- Be able to know src-dst of the pod connections
- Use it as sidecar
- Try to imagine a win-win solution (aka quick and dirty)
Implementation
Project https://github.com/lorenzogirardi/Kubernetes-nstats
My colleagues has done an amazing work with a GO container able to have this kind of observability.
I tried to imagine a prototype with a win-win solution and i started evaluation this interesting project,
where most the work as already done with the following steps:
- Create an iftop static dump
- Filter the results in a matrix
- Build an influxdb layout to POST directly to the database
so ... let's share some evidence
Kubernetes-nstats
|-- Dockerfile
|-- README.md
|-- cron.sh
|-- crontab
|-- format.py
`-- parse.awk
Dockerfile
FROM debian:stretch-slim
MAINTAINER lgirardi <[email protected]>

RUN apt-get -y update && apt-get -yq install \
	iftop \
	python3 \
	cron \
	curl


RUN touch /var/log/cron.log
RUN mkdir /code
WORKDIR /code
ADD . /code/
RUN chmod +x /code/cron.sh
COPY crontab /etc/crontab
RUN crontab /etc/crontab
CMD env > /code/env.sh ; cron -f
CRON ?!?!?! ... yes it's a prototype and for this scope k8s cronjob are not effective. The most interesting part is env > /code/env.sh that is used to create an environment file based on the docker environment variables.
Code
cron.sh
#!/bin/bash
/usr/sbin/iftop -nNb -i $(grep IFACE /code/env.sh |cut -d= -f2) -s 10 -o 10s -t -L 100 2>/dev/null |/usr/bin/awk -f /code/parse.awk |/usr/bin/python3 /code/format.py |/usr/bin/curl -i -XPOST 'http://'"$(grep INFLUX /code/env.sh |cut -d= -f2)"'/write?db='"$(grep IDB /code/env.sh |cut -d= -f2)"'' --data-binary @-
parse.awk
#!/bin/awk -f
BEGIN {
	numlist = 0
	nblines = 15
}
{
	if ( numlist == 1 && $1 == "--------------------------------------------------------------------------------------------" ) {
		exit
	}

	if ( numlist == 0 && $1 == "--------------------------------------------------------------------------------------------" ) {
		numlist = 1
		next
	}

	if ( numlist == 1 ) {
		if ( $0 ~ "=>" && nblines > 0 ) {
			SENDER = $2
			STX = pfFormat($5)
			getline
			RECEIVER = $1
			RTX = pfFormat($4)
			printf "%s,%s,%s,%s\n", SENDER, RECEIVER, RTX, STX
			nblines--
			if ( nblines < 1 ) {
				exit
			}
		}
		next
	}
}
END {
}

function pfFormat(str) {
 	sub("b","",str)
	return str
}
format.py
#!/usr/local/bin/python3

import csv
import socket
import sys
import re

def getHostName(ipAddress):
	hostName = ipAddress

	try:
		hostName = socket.gethostbyaddr(ipAddress.strip())[0]
	except socket.herror:
		pass

	return hostName

def prefixToMultiplier(prefix):
	multiplier = {
		'K': 1000,
		'M': 1000000,
    'G': 1000000000
	}

	return multiplier.get(prefix, 1)


def expandBitRate(bitRate):
	groups = re.match(r"(\d+\.?\d*)(?:(K|M|G)?)", bitRate).groups()
	multiplier = 1.0
	if len(groups) > 1:
		multiplier = prefixToMultiplier(groups[1])

	value = float(groups[0])
	return value * multiplier

host = socket.gethostname()

with sys.stdin as csvfile:
	csvReader = csv.reader(csvfile)
	for row in csvReader:
		(senderIp, receiverIp, receiveRate, sendRate) = (row[0], row[1], expandBitRate(row[2]), expandBitRate(row[3]))
		sender = getHostName(senderIp)
		receiver = getHostName(receiverIp)
		print("nstat,hosts=" + host +",sender=" + sender + ",receiver=" + receiver + " sendRate=" + str(sendRate) + ",receiveRate=" + str(receiveRate))
crontab
SHELL=/bin/bash
PATH=/usr/local/sbin:/usr/local/bin:/sbin:/bin:/usr/sbin:/usr/bin
* * * * *  sh -x /code/cron.sh >> /var/log/cron.log 2>&1
#
So that this stuff is doing ?
/usr/sbin/iftop -nNb -i $(grep IFACE /code/env.sh |cut -d= -f2) -s 10 -o 10s -t -L 100 2>/dev/null on this part is defined a 10 second of dump sorted on the last 10second column.

at this point the awk parsing | /usr/bin/awk -f /code/parse.awk

the format part done by python script | /usr/bin/python3 /code/format.py

and finally we ship the metrics to influxdb with | /usr/bin/curl -i -XPOST 'http://$IP/write?db=$DB' --data-binary @-
Results
You can build an run locally docker build -t nstats .docker run -d -e IFACE=eth0 -e INFLUX=192.168.1.28:8086 -e IDB=test nstats
or add into kubernetes in an existing pod
it is quite simple and doesn't need any refactoring
      containers:
      - image: lgirardi/py-test-backend
        imagePullPolicy: Always
        name: pytbak
    etc etc etc ....
      - env:
        - name: IFACE
          value: eth0
        - name: INFLUX
          value: 192.168.1.28:8086
        - name: IDB
          value: test
        image: lgirardi/nstats
        imagePullPolicy: Always
        name: nstats
What you should have on your grafana reflect the network usages
