HPA vs Rate-limit

Table of Contents
- INTRO
- GOALS
- Limits
- Hands-on
- Simulation
- NO AUTOSCALING
- AUTOSCALING
- 1 pod start - hpa 33rps - 15 min - 99 max requests
- 2 pod start - hpa 33rps - 15 min - 99 max requests
- 1 pod start - hpa 30rps - 15 min - 99 max requests
- 1 pod start - hpa 27rps - 15 min - 99 max requests
- [optimal] 1 pod start - hpa 24rps - 15 min - 99 max requests
- 1 pod start - hpa 25rps - 15 min - 99 max requests
- AUTOSCALING Internal rate limit
- AUTOSCALING envoy rate limit
- Unexpected traffic
- Conclusions
- Simulation
Strange ... we are using hpa to increase the availability and we are introducing rate limit to reduce?
Well let's create the context...
INTRO
This story is not a true o false sentence, it's a sort of analysis based on a few assumptions:
- cloud environment
- dynamic infrastructure
- minimum resources available
HPA
In Kubernetes, a HorizontalPodAutoscaler automatically updates a workload resource (such as a Deployment or StatefulSet), with the aim of automatically scaling the workload to match demand.
Patterns
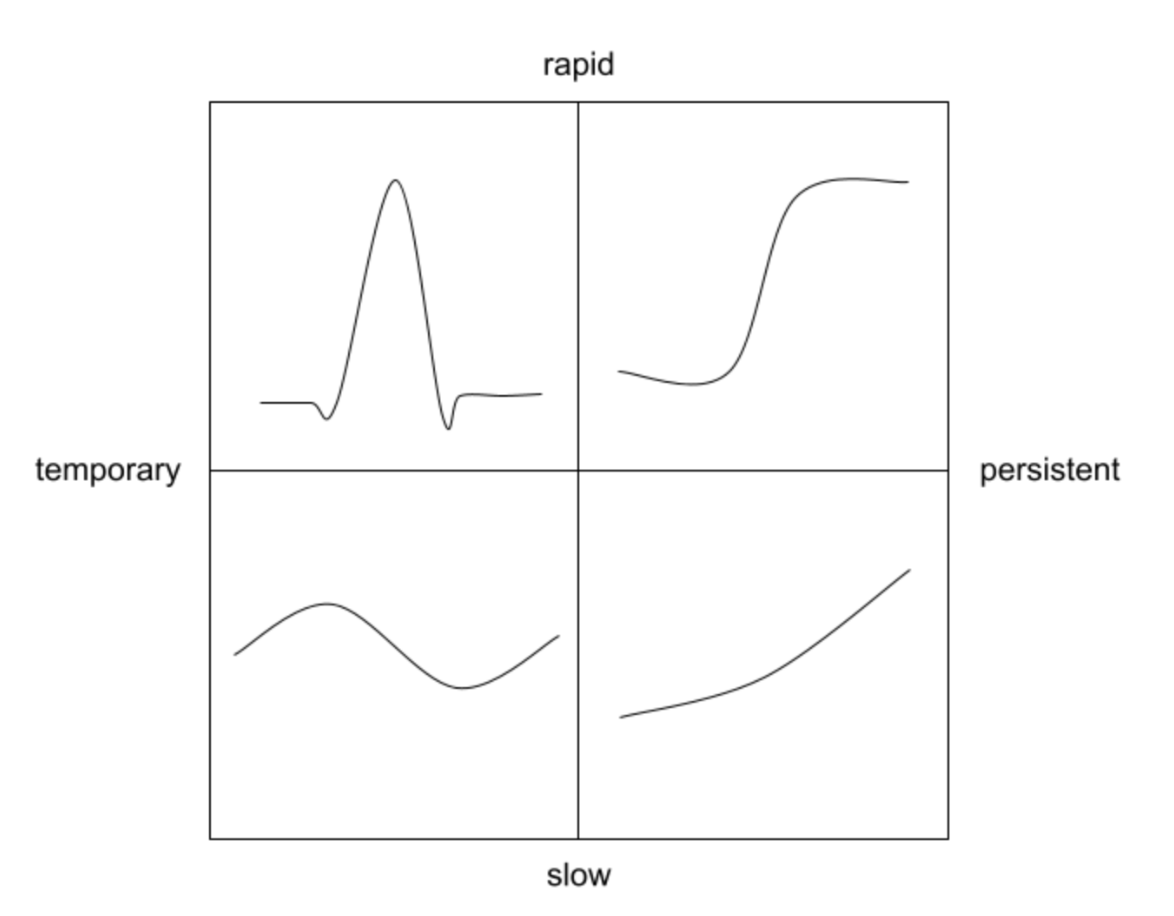
Meaning
| Type | Behaviour |
| Slow and temporary | it might have daily fluctuations in requests volume, peaking during the day and troughing at night |
| Rapid and temporary | it might be subject to short bursts of high request volume from poorly-behaved downstream services |
| Slow and persistent | it might see its request volume slowly increase over rime, as the product sees greater adoption |
| Rapid and persistent | it might see abrupt shift from low to high volumes, such as if it's called by batch jobs |
Ideal Practice
| Type | Behaviour |
| Slow and temporary | The HPA should add and remove pods as necessary |
| Rapid and temporary | The HPA should not modify the pod count; instead, the service should leave enough headroom to deal with these brief spikes with only existing pods |
| Slow and persistent | The HPA should add and remove pods as necessary |
| Rapid and persistent | The service should leave enough headroom to deal with the rapid change, and the HPA should add pods soon after to bring the service back to target utilization |
Rate Limit
A rate limit is the number of API calls an app or user can make within a given time period. If this limit is exceeded or if CPU or total time limits are exceeded, the app or user may be throttled. API requests made by a throttled user or app will fail. All API requests are subject to rate limits.
However, keep the HPA patterns as a reference even for this one.
GOALS
- Understand how much we can close with the application enervation during an autoscaling situation using rate limit
- Understand how to handle unexpected traffic with rate limit
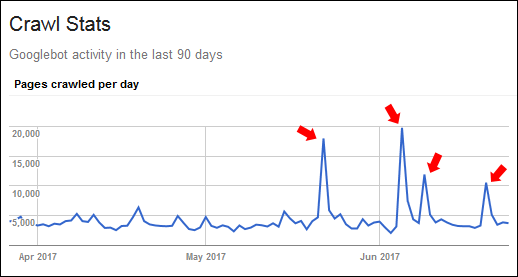
Limits
Sometimes we can have a spike of requests that are legit... for example consider the google crawlers (image from ... somewhere in google image)
Hands-on
Simulation
- python app that generates fibonacci sequence
- fibonacci number 18500
- load test done using gatling
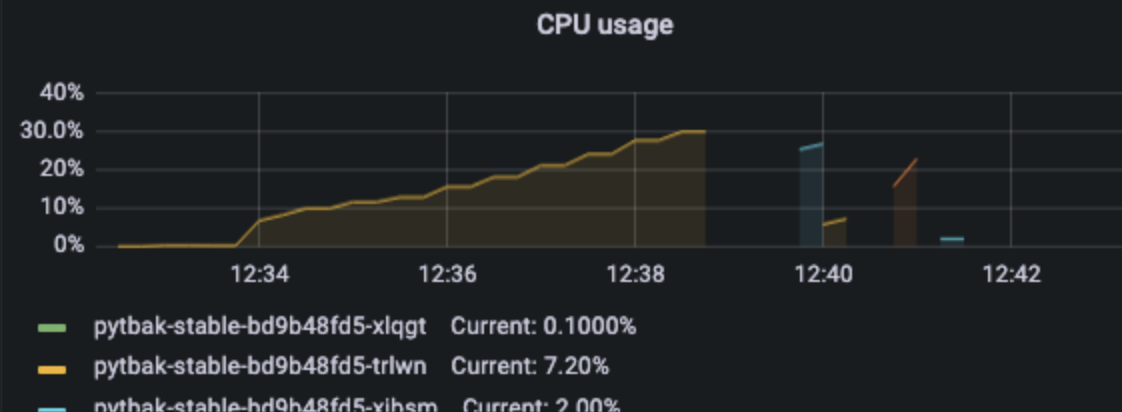
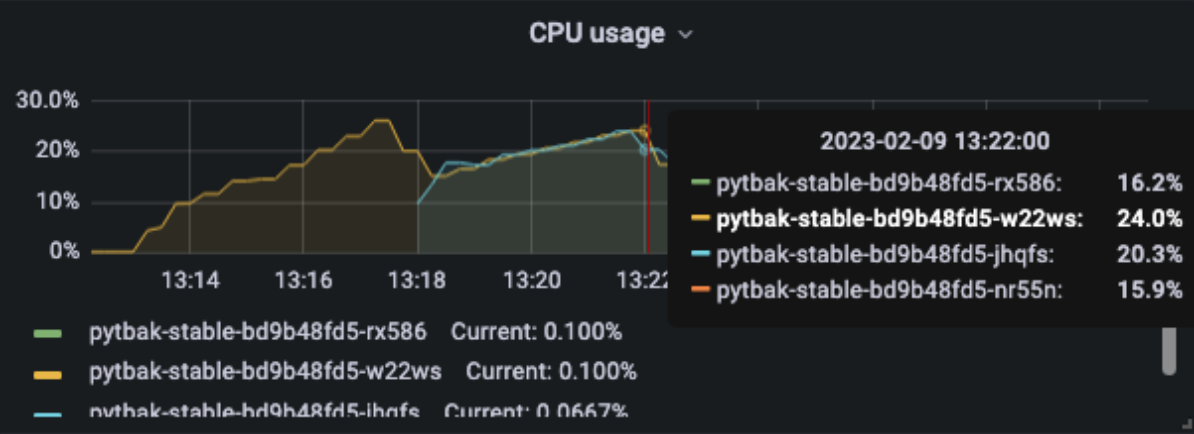
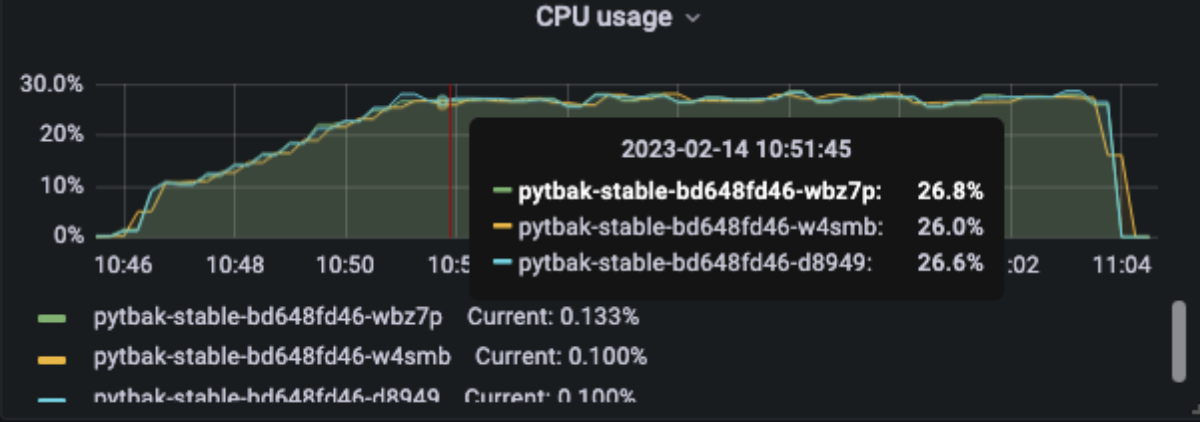
- Application capped on cpu (each request is ~10mcpu) with max of 300mcpu for pod (cpu bound)
- Hpa based on keda flask_http_request_duration_seconds_count
Results Example
$ curl http://xxx/api/fib/18500
8353329688443562486779853158514... etc etc
This ensures that it is not just an echo answer and that we have work behind the scenes.
Note
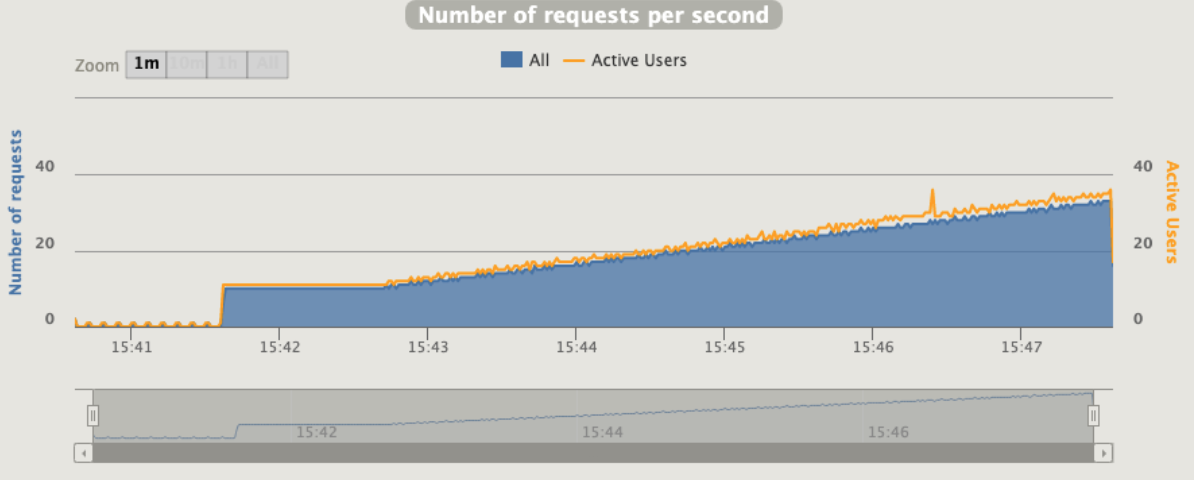
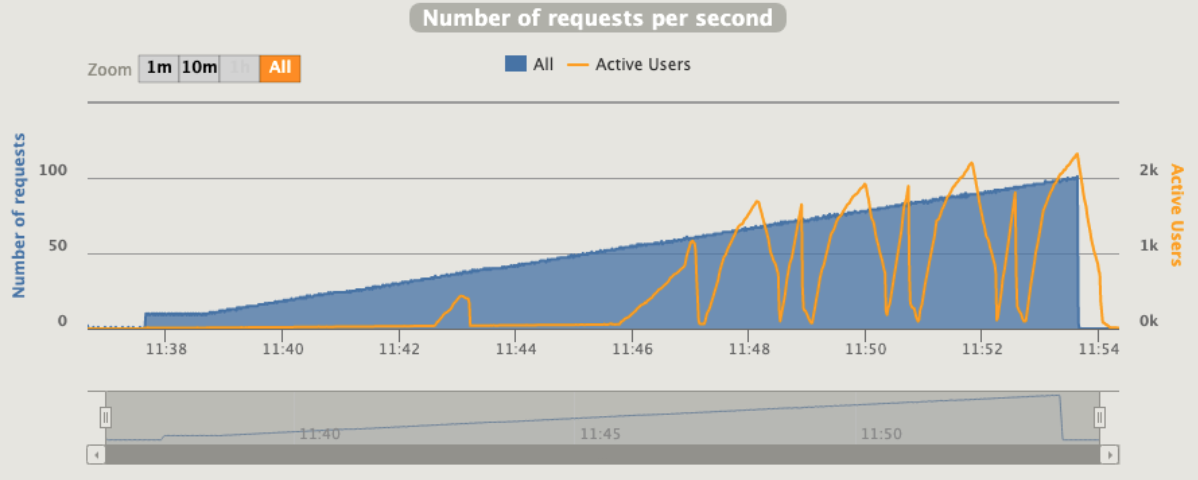
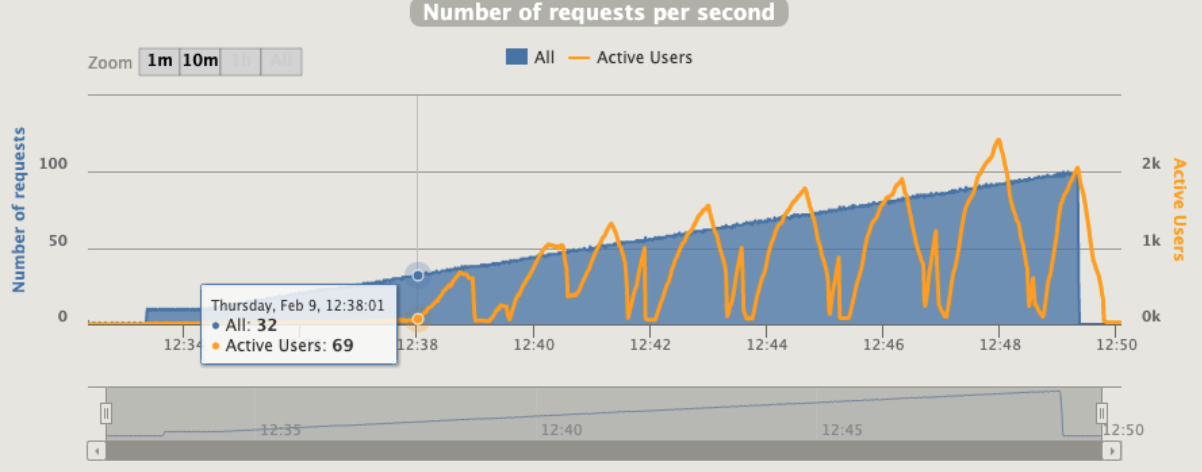
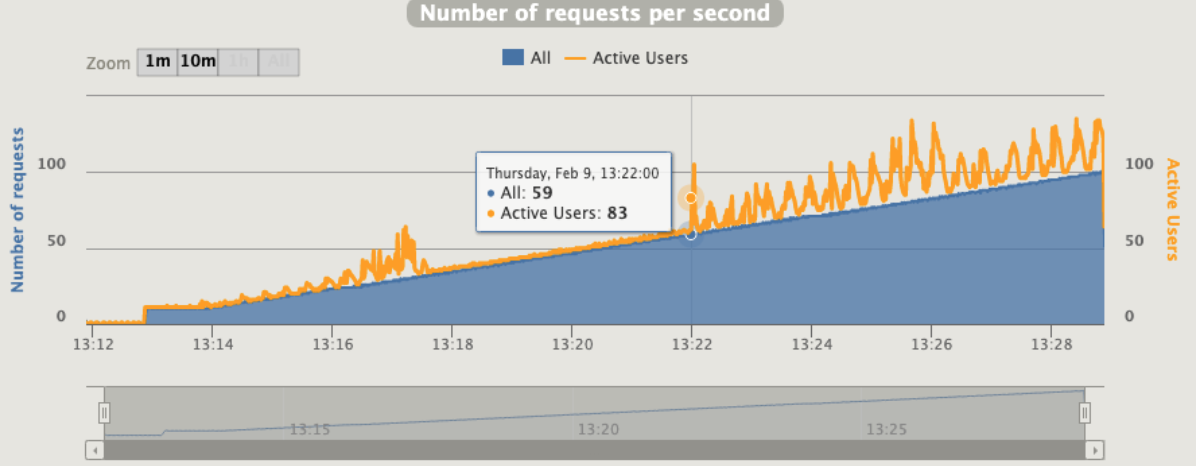
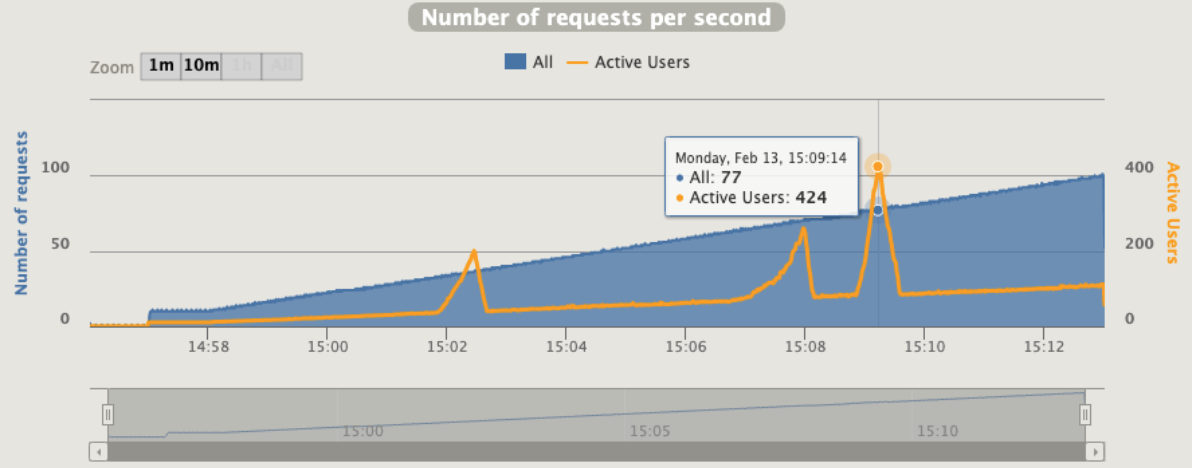
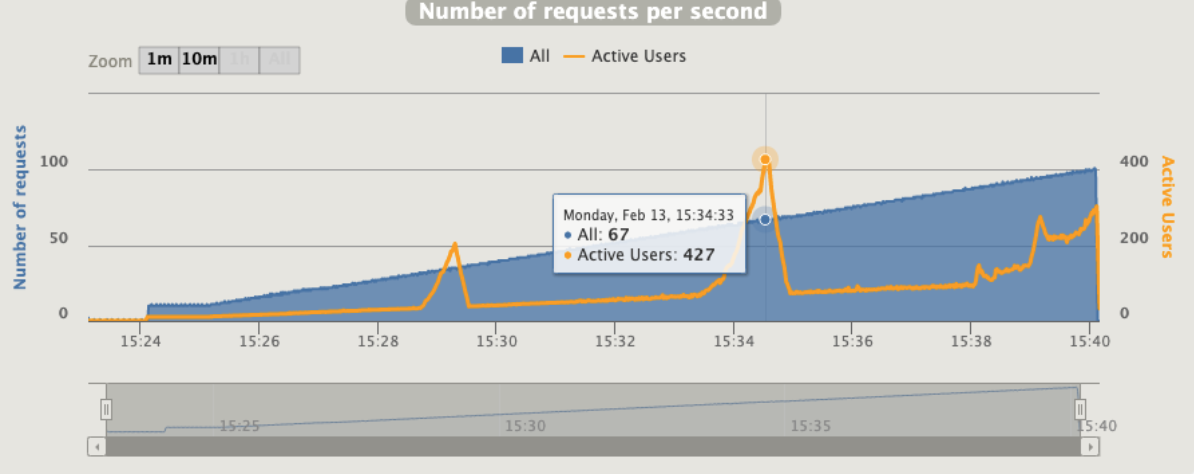
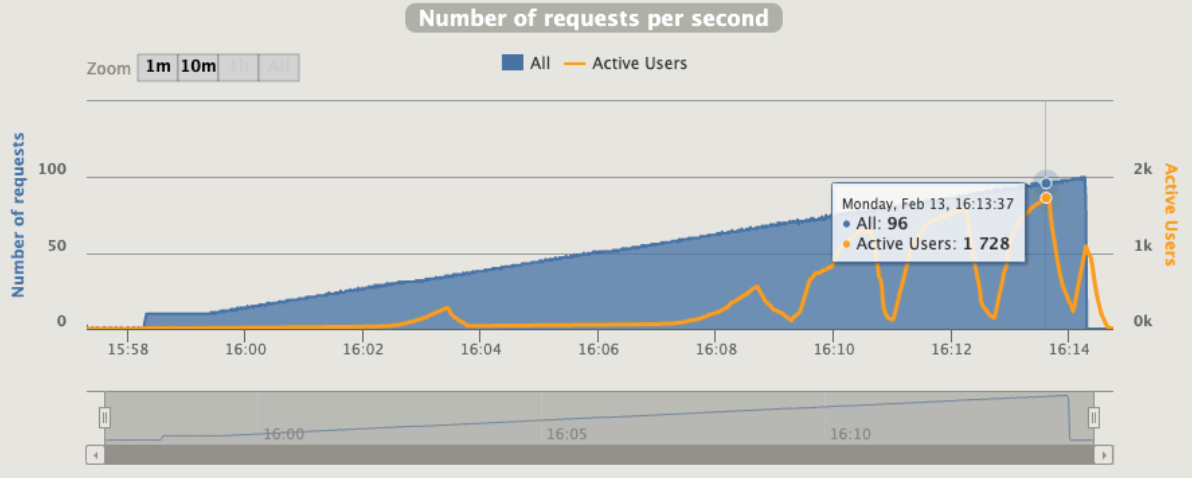
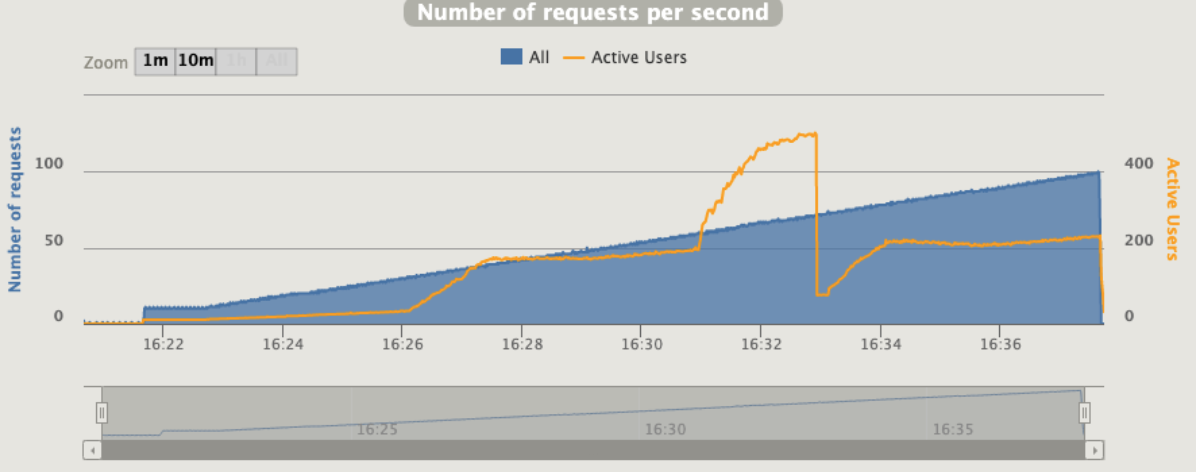
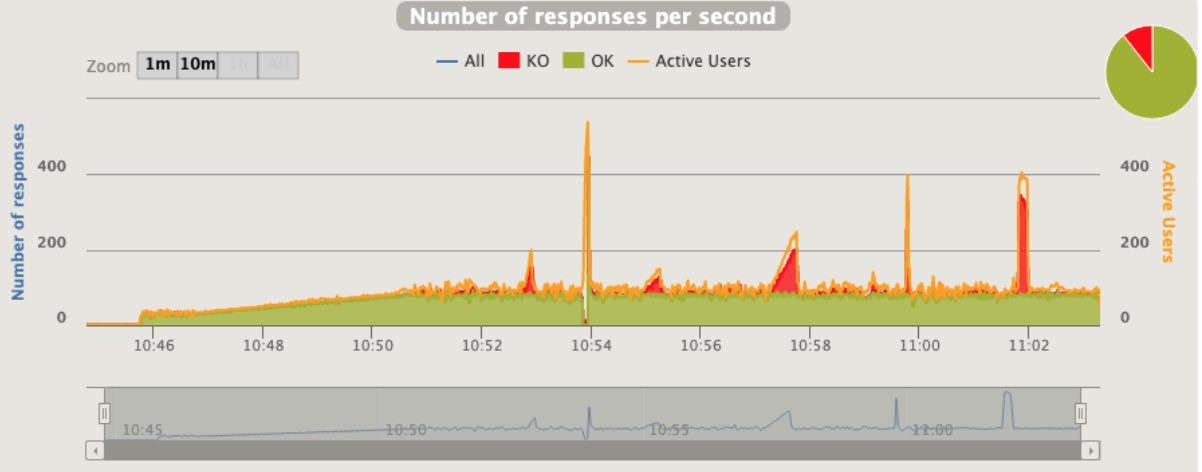
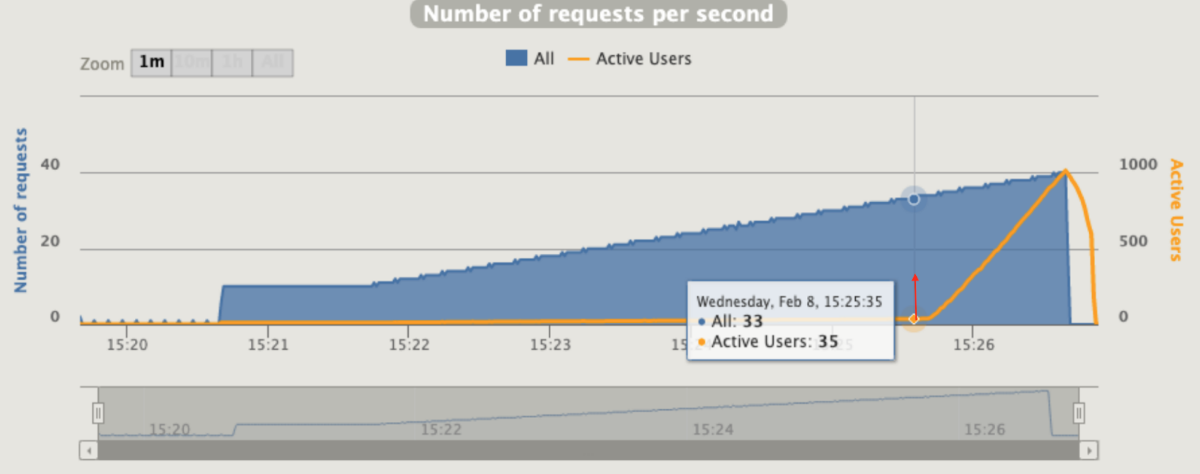
Gatling is using an interesting concept that call "active users"
“Active users” is neither “concurrent users” or “users arrival rate”. It’s a kind of mixed metric that serves for both open and closed workload models and that represents “users who were active on the system under load at a given second”.
It’s computed as:
(number of alive users at previous second)
+ (number of users that were started during this second)
- (number of users that were terminated during previous second)
NO AUTOSCALING
First run 40rps max
rampUsers(10).during(60.seconds), // increase users to 10 in 60 sec
constantUsersPerSec(10).during(60.seconds), // keep 10 users for 60 sec
rampUsersPerSec(10).to(40).during(5.minutes), // increase users to 40 in 5 min
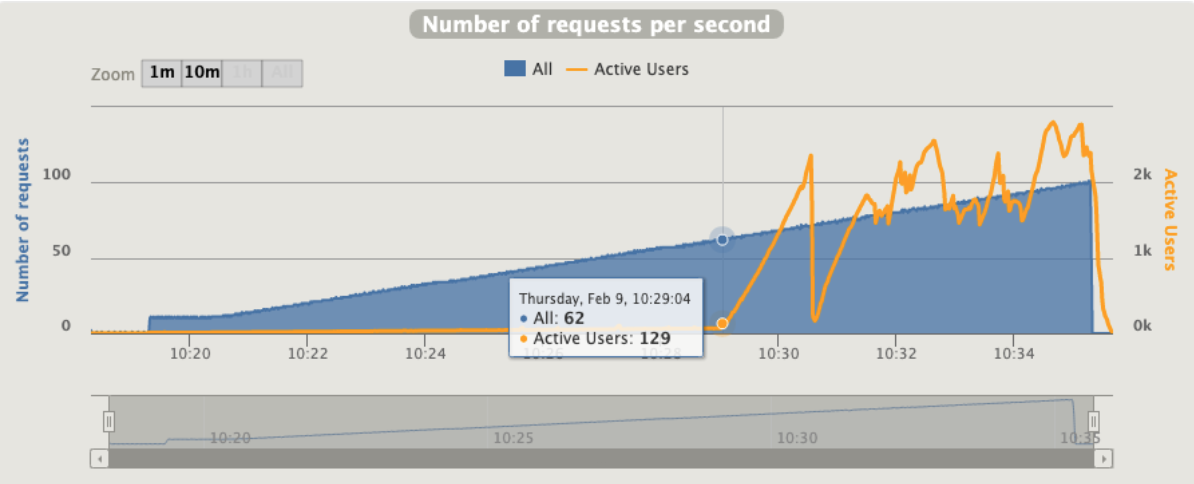
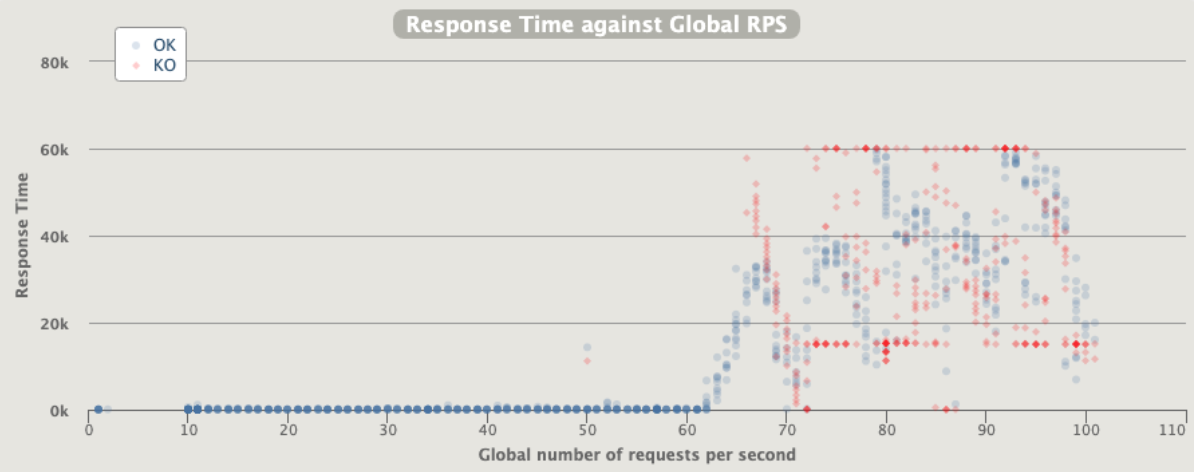
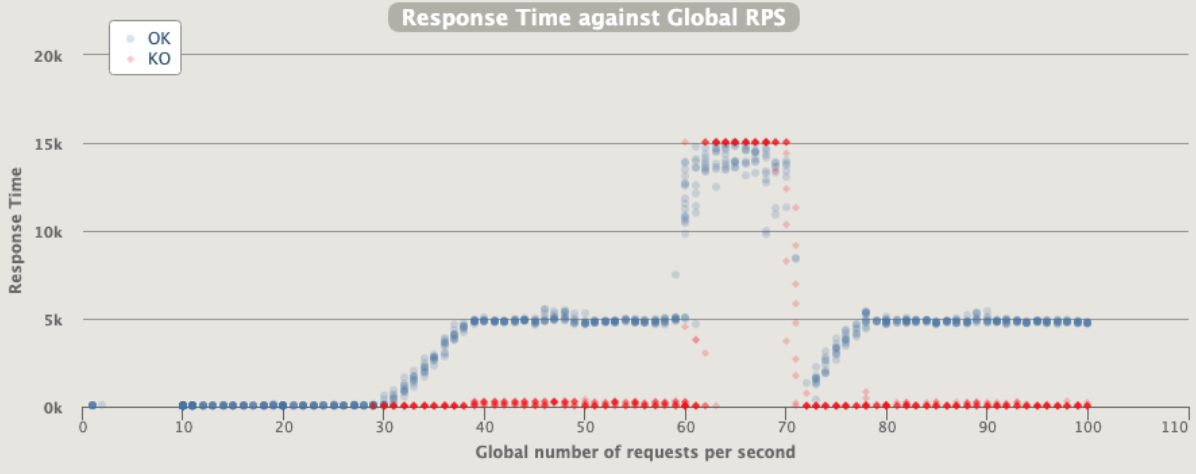
As soon as we reach the limit the pods start to be unresponsive
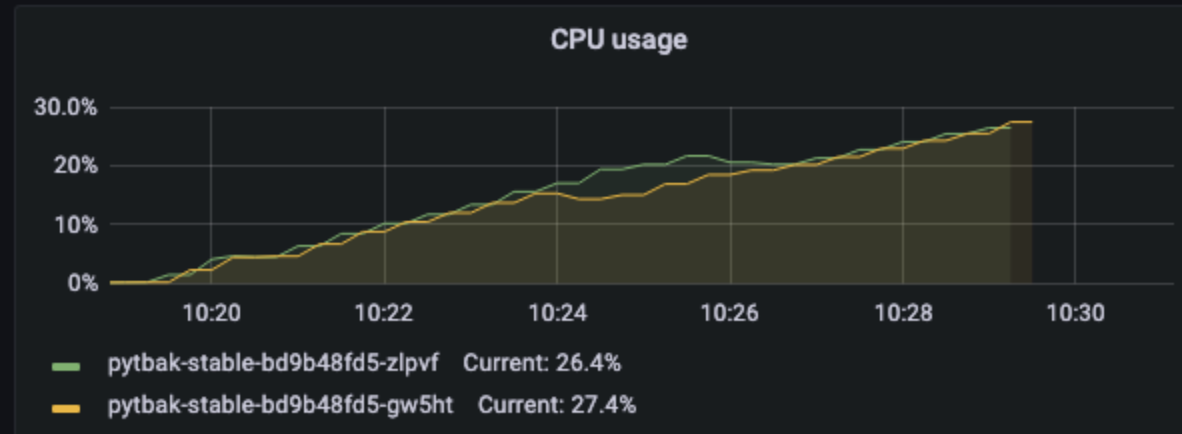
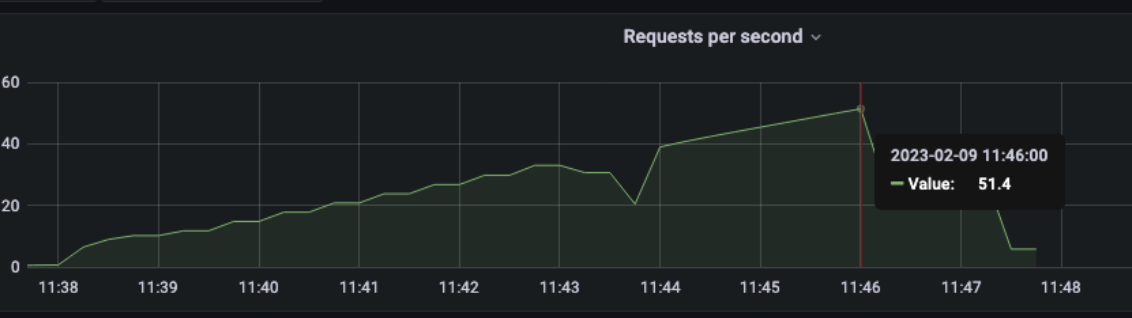
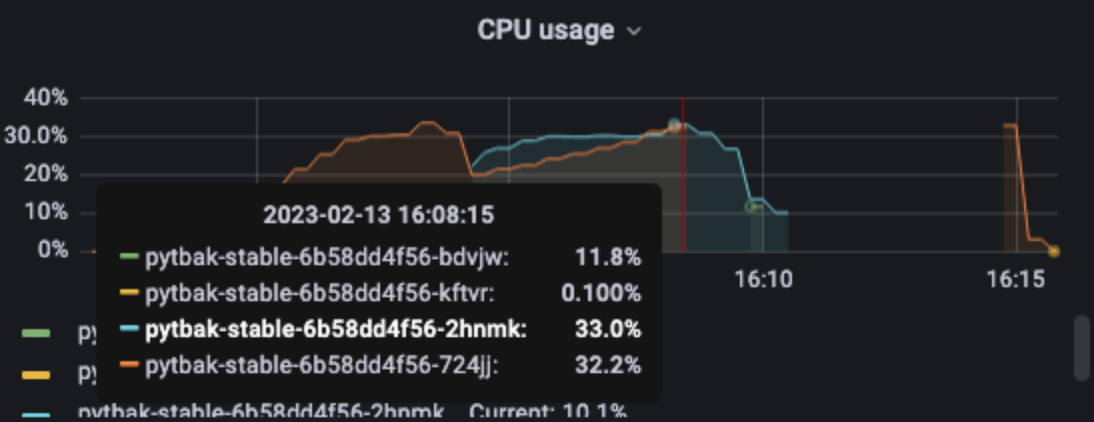
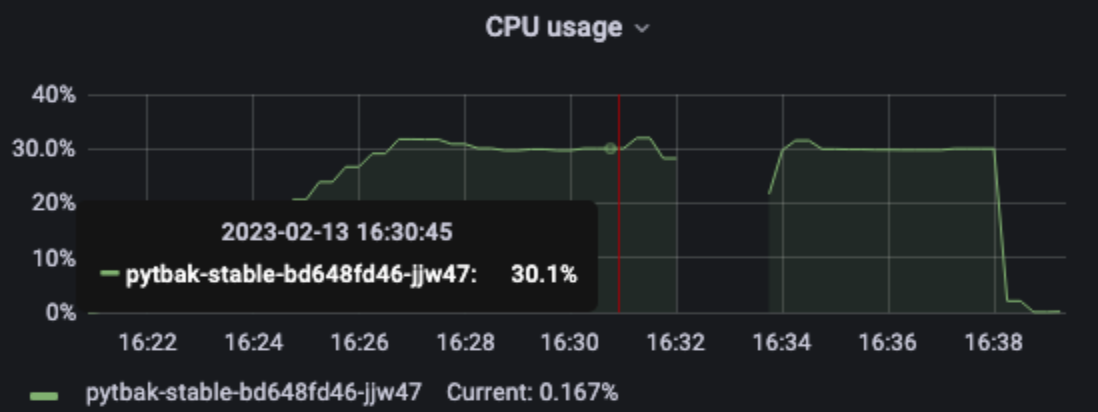
No metrics after 33 rps, pod crashed
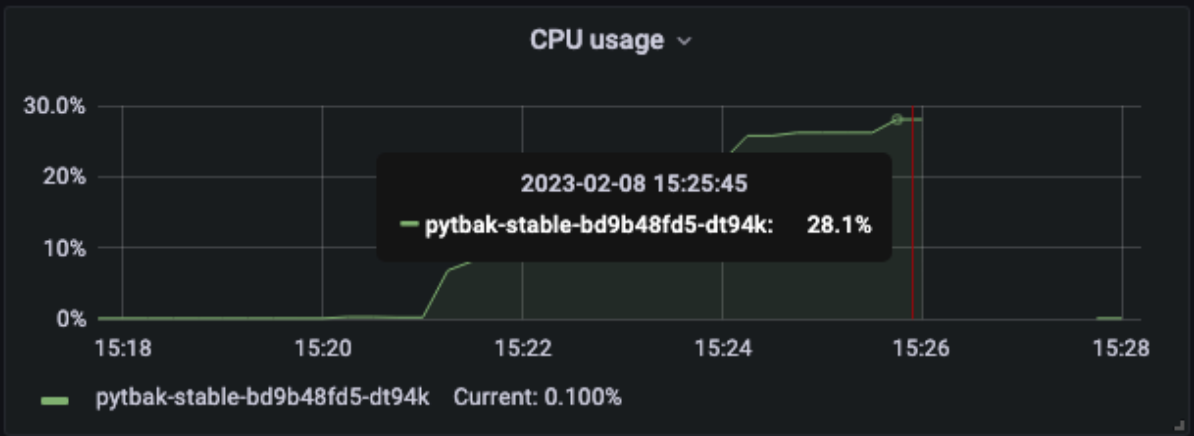
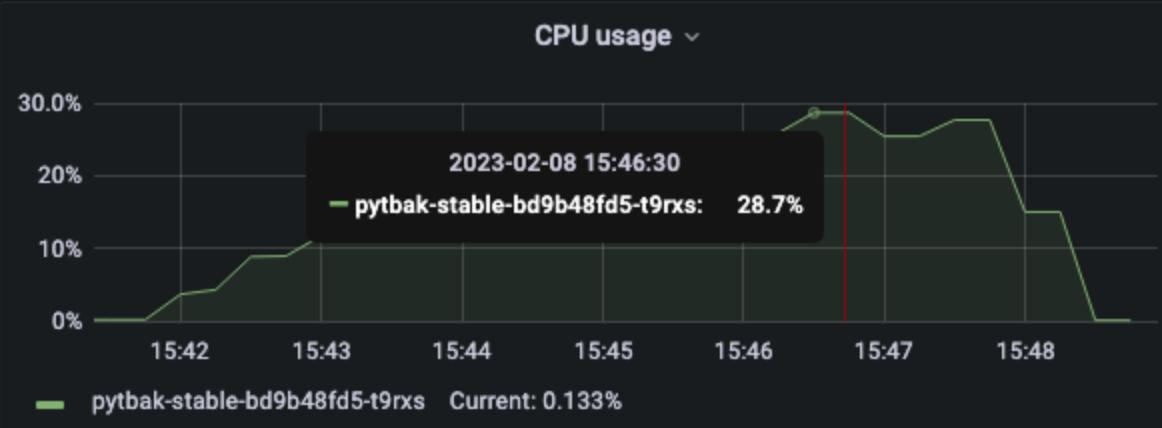
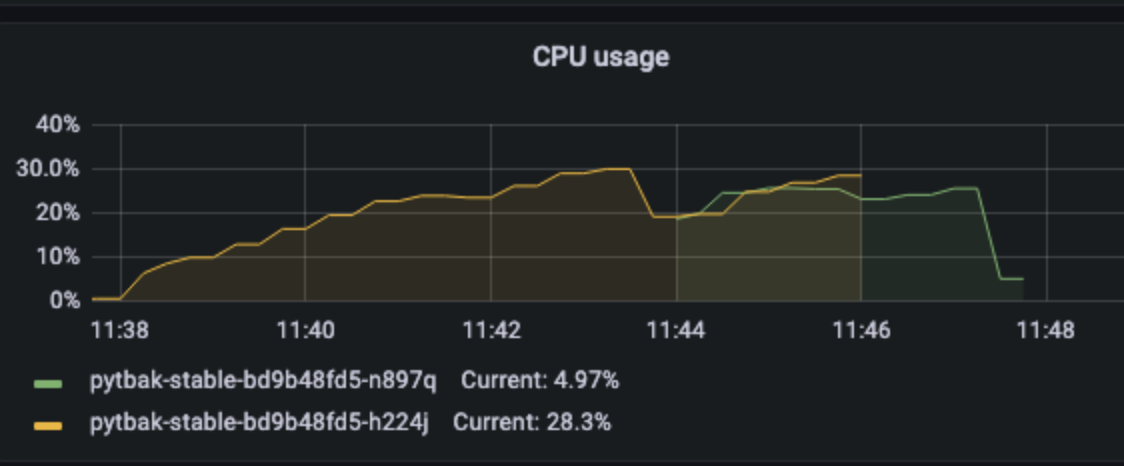
No metrics after >28% of cpu (consider the max as 30% as the pod limit is 300mcpu)
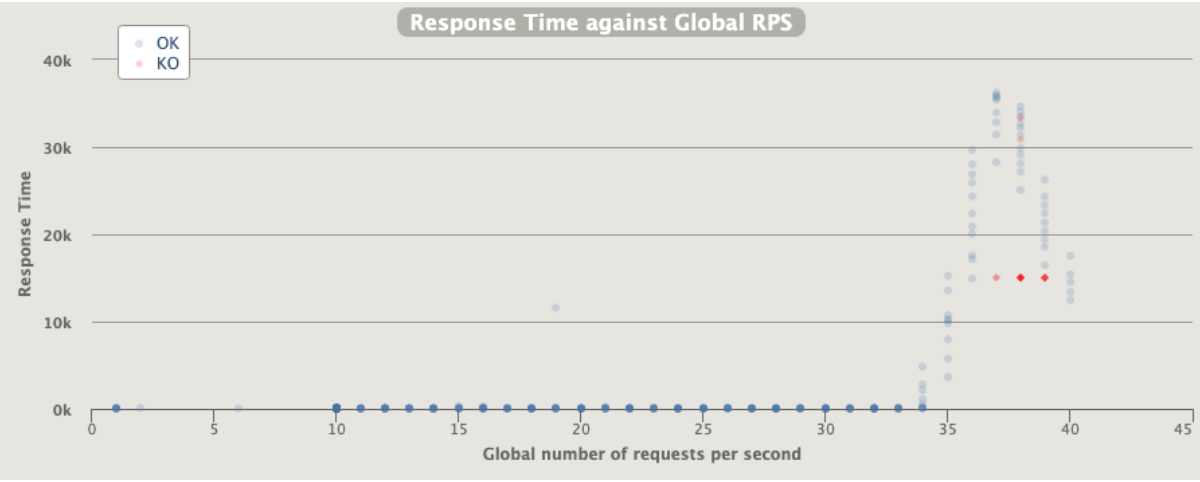
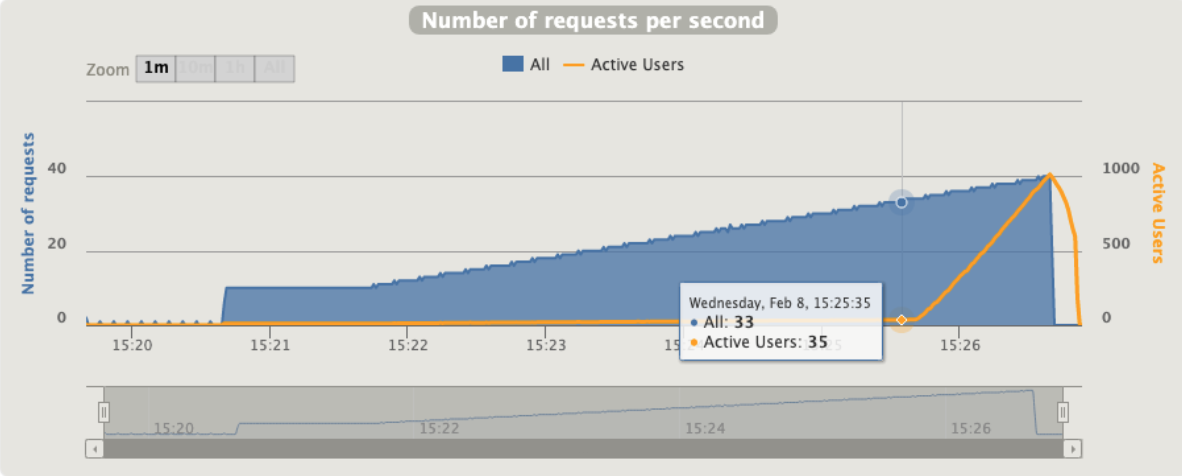
Active users increase dramatically after 33 rps
Second run 33rps max
rampUsers(10).during(60.seconds), // increase users to 10 in 60 sec
constantUsersPerSec(10).during(60.seconds), // keep 10 users for 60 sec
rampUsersPerSec(10).to(30).during(4.minutes), // increase users to 30 in 4 min
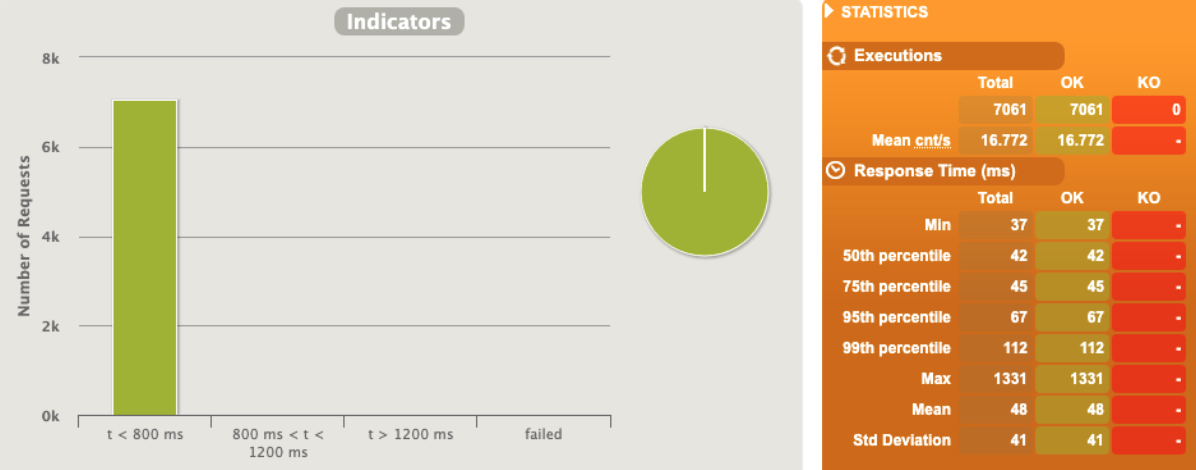
Really better, we can say that the MAX rps is 33 ... this valid one-shot in a single run
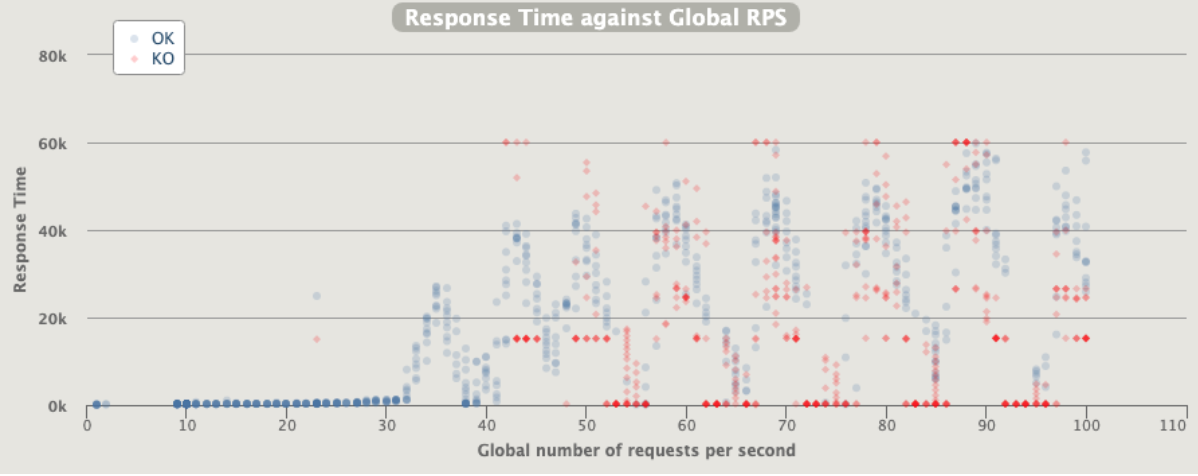
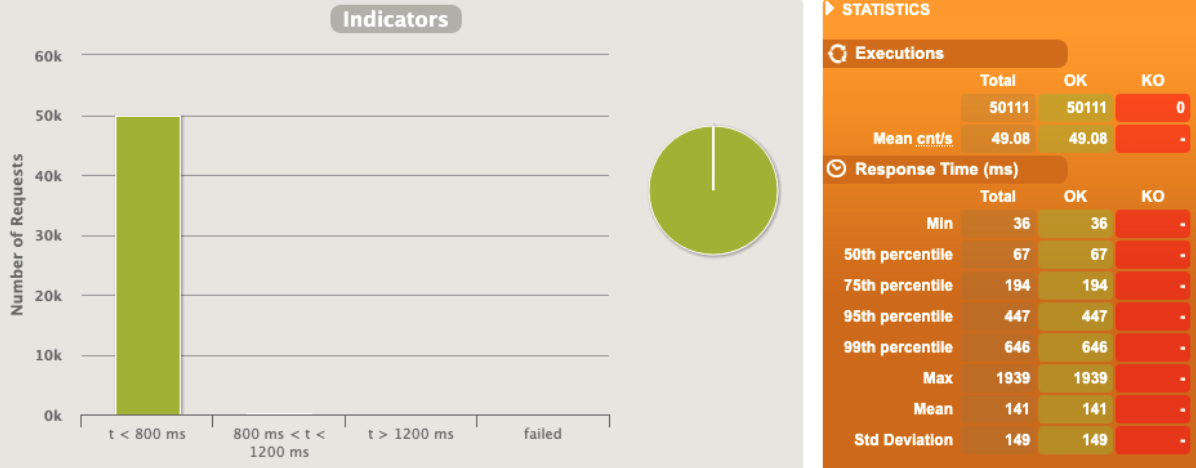
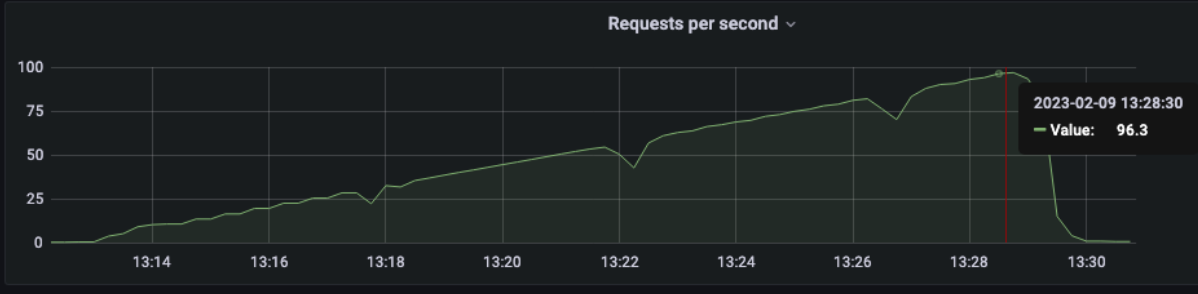
AUTOSCALING
rampUsers(10).during(60.seconds), // increase users to 10 in 60 sec
constantUsersPerSec(10).during(60.seconds), // keep 10 users for 60sec
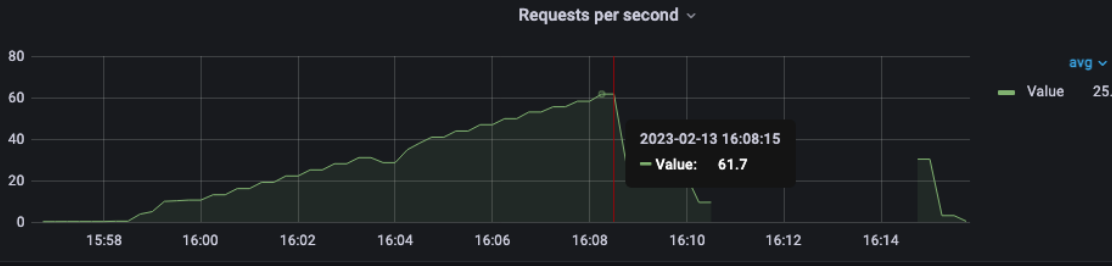
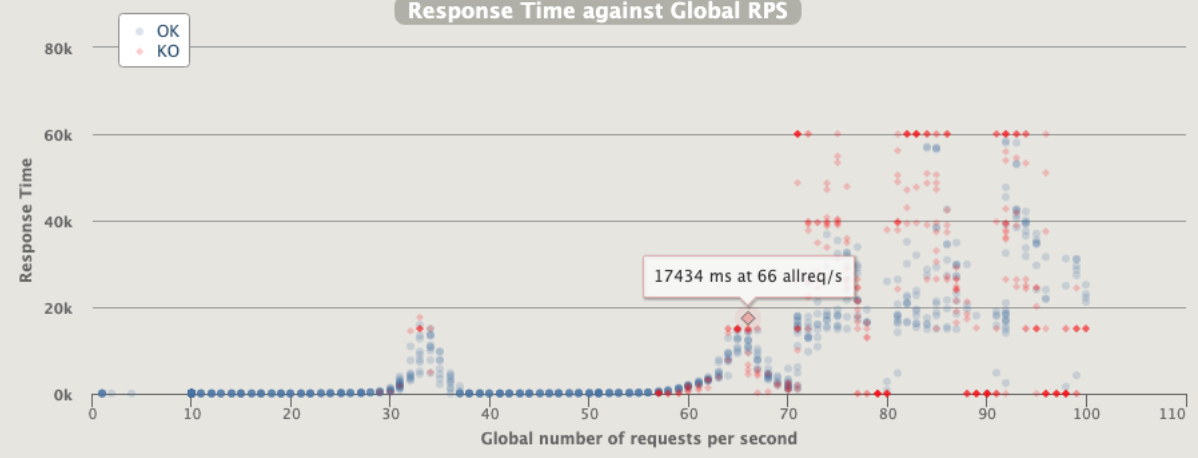
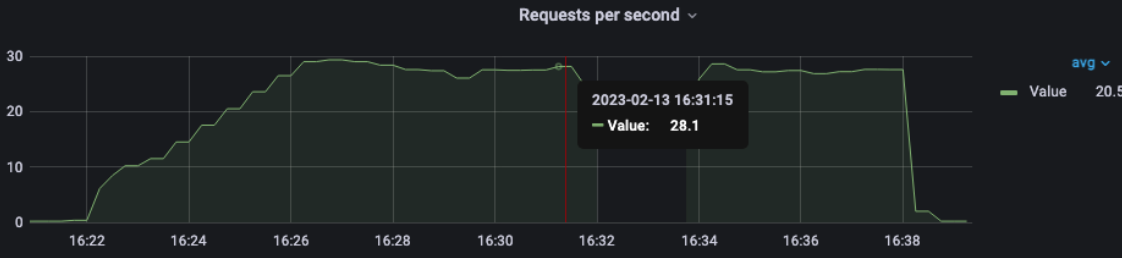
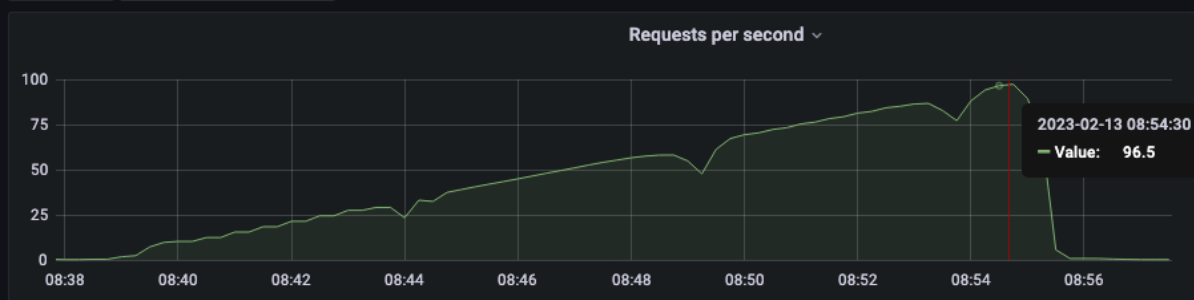
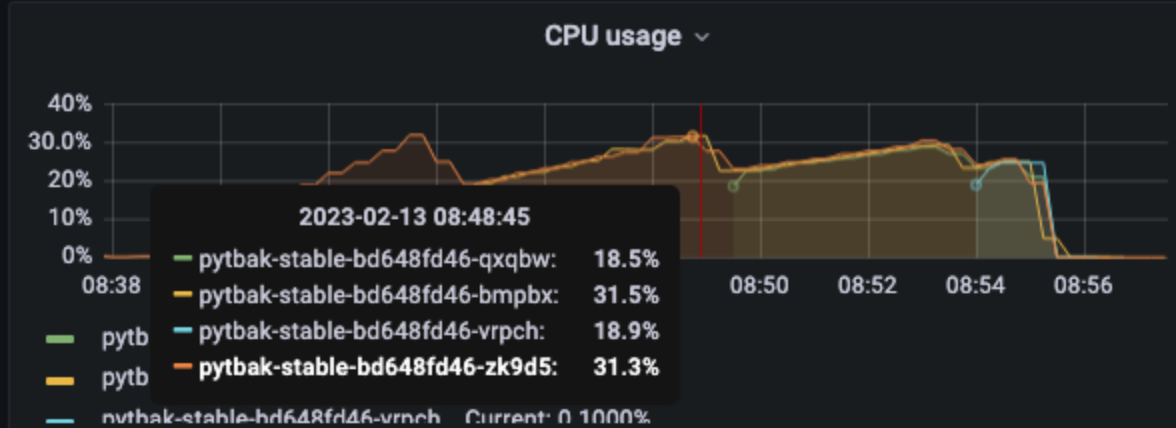
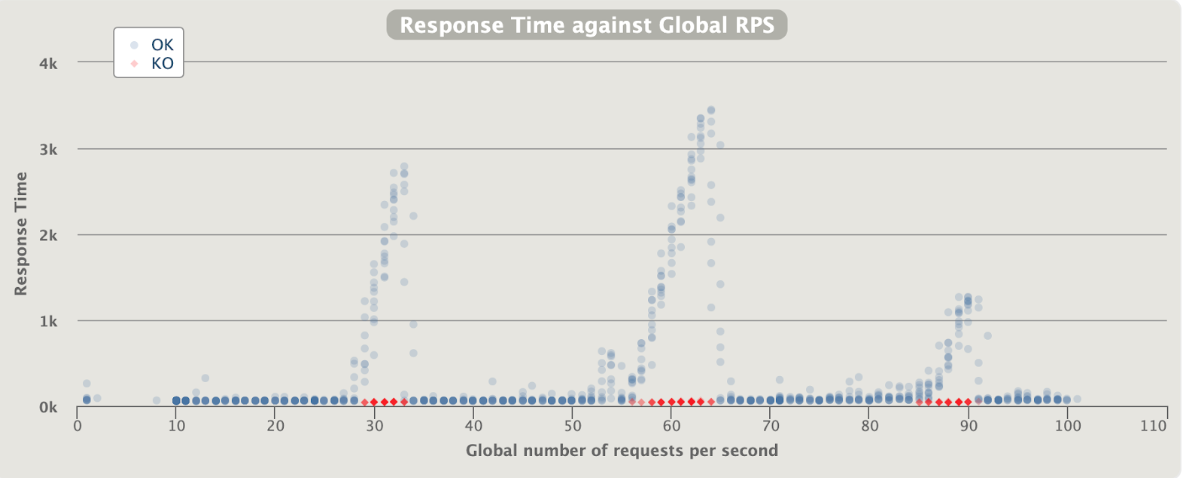
rampUsersPerSec(10).to(99).during(15.minutes), // increase users to 99 in 15 min
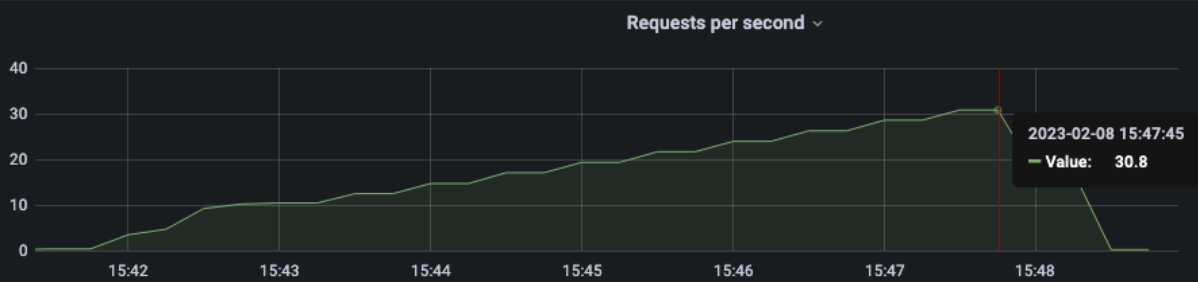
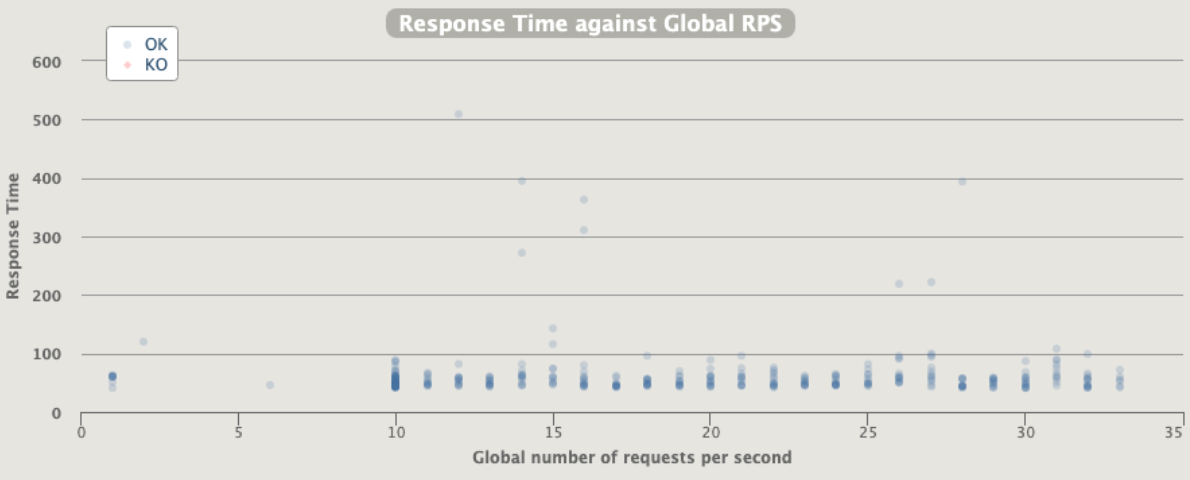
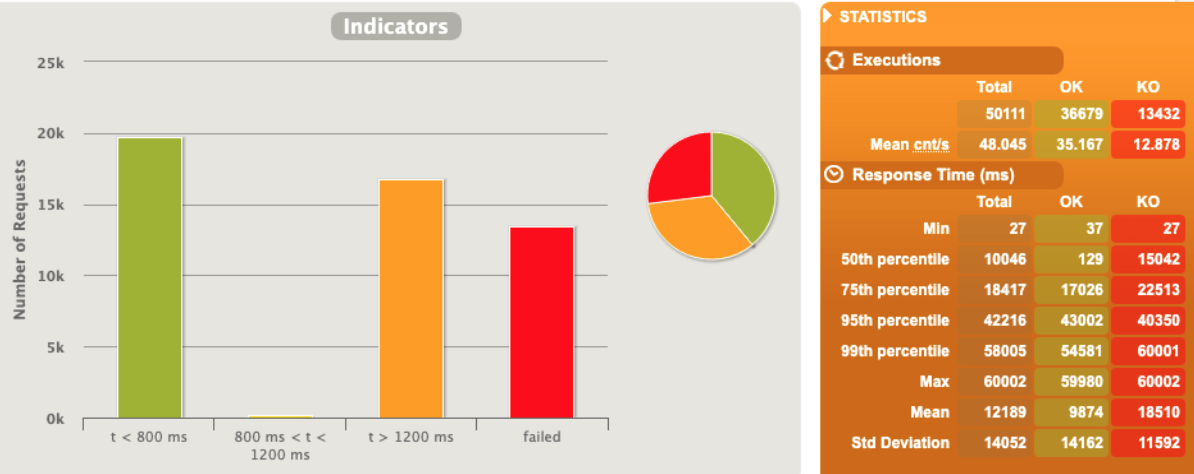
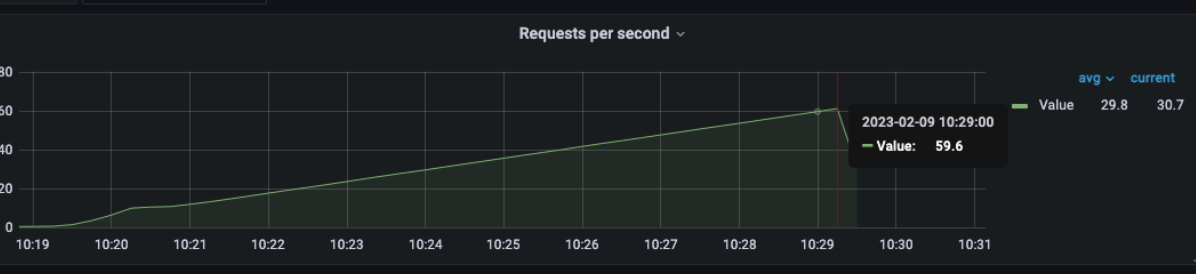
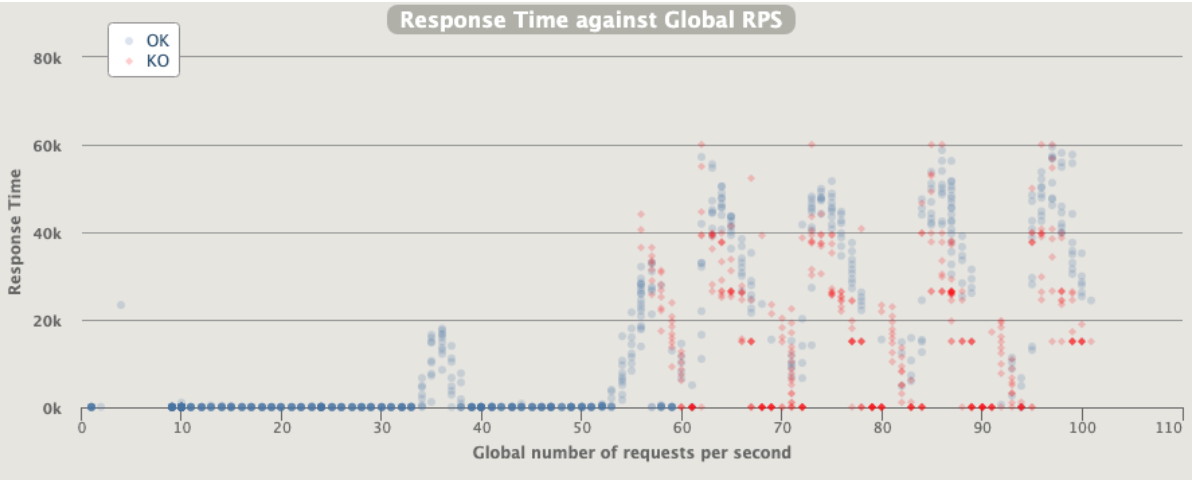
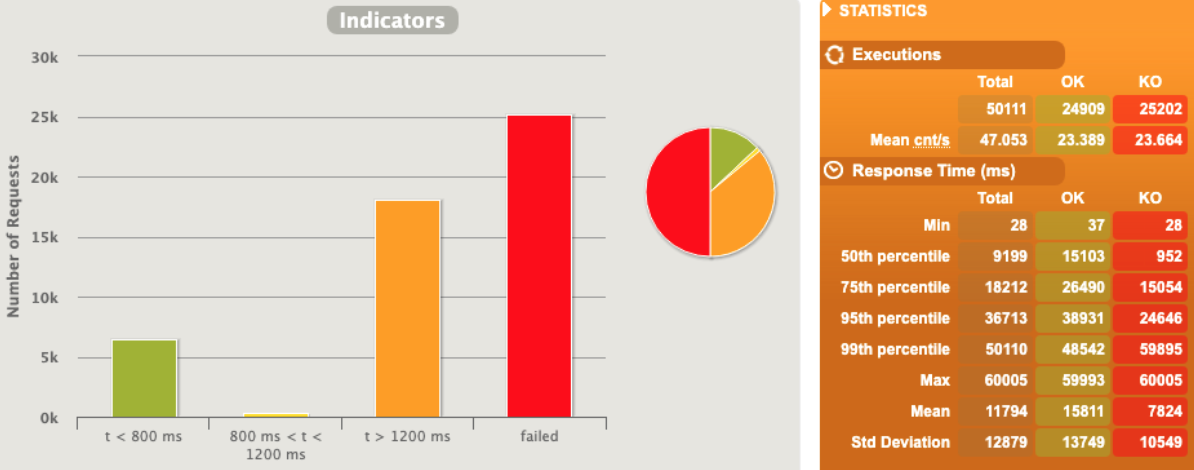
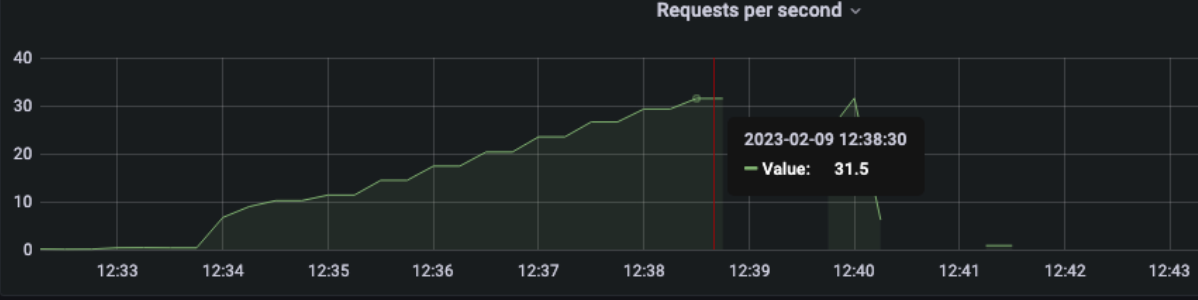
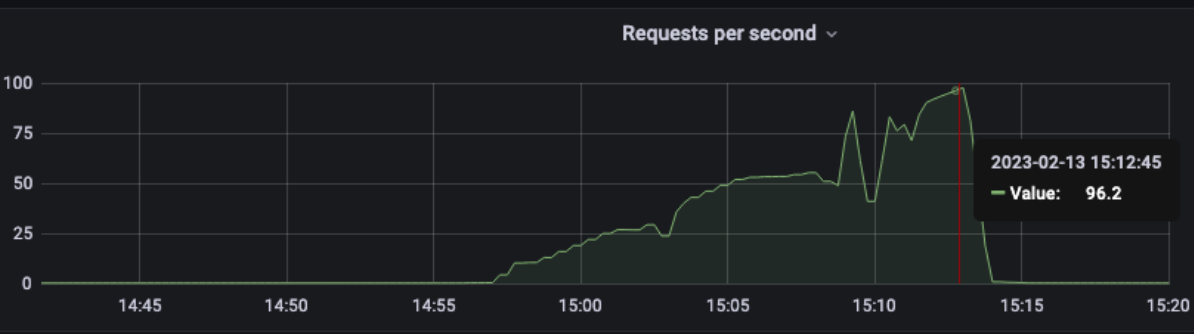
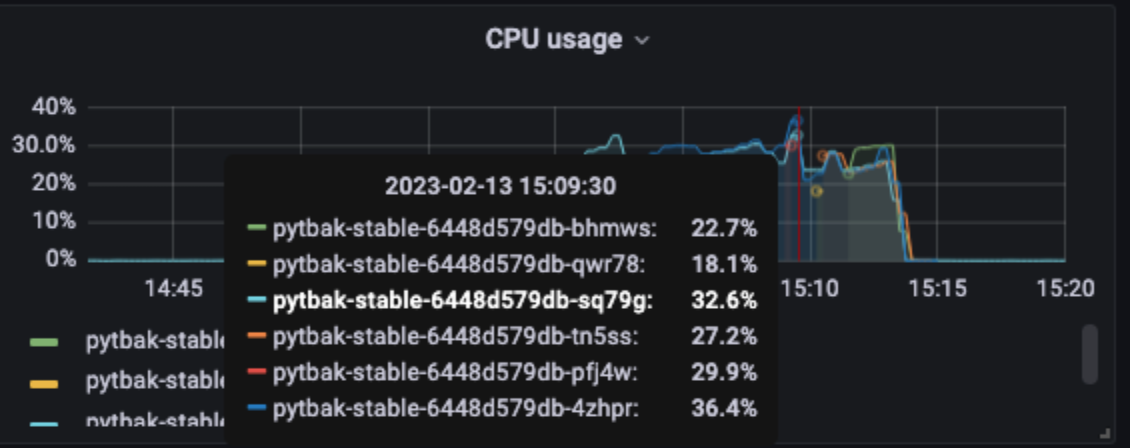
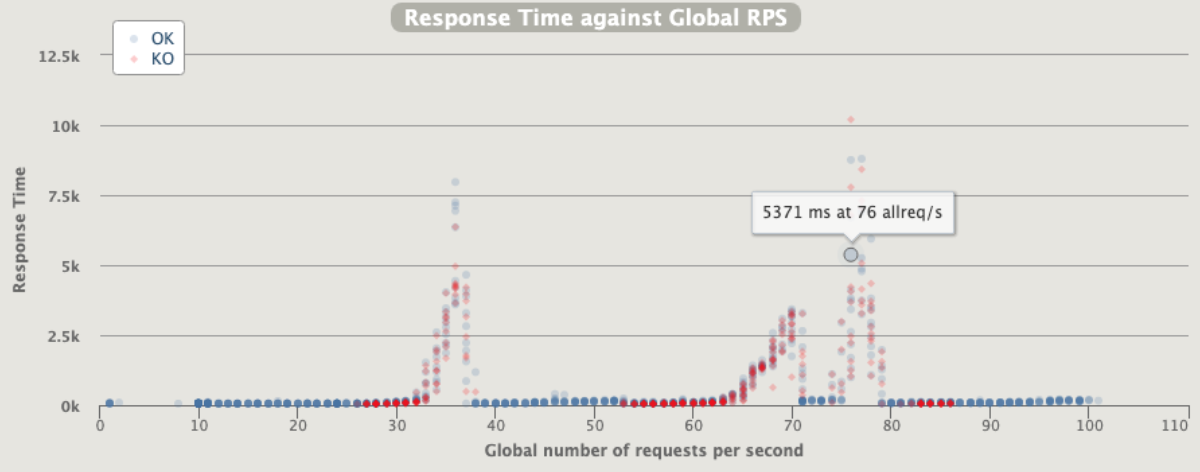
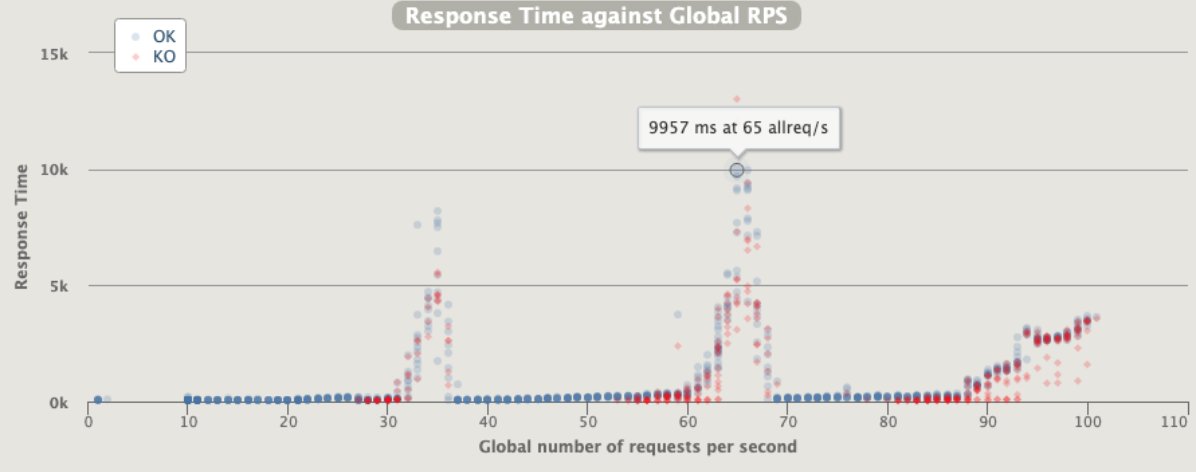
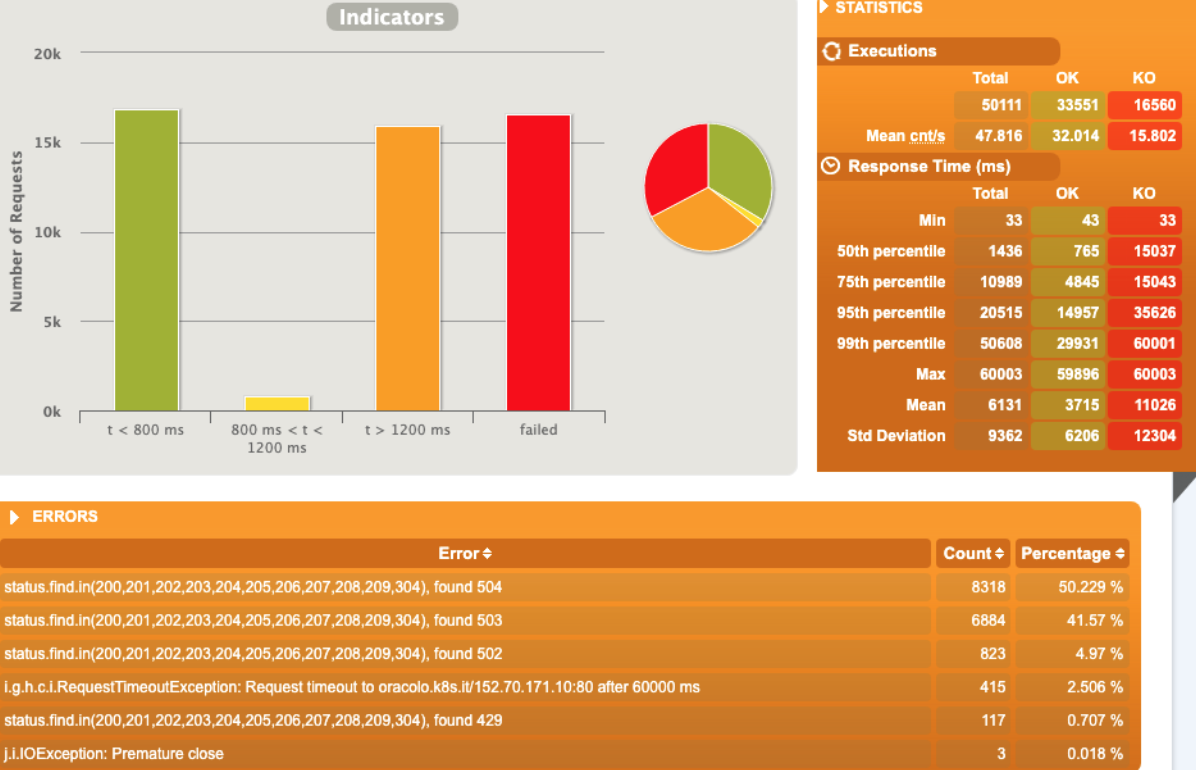
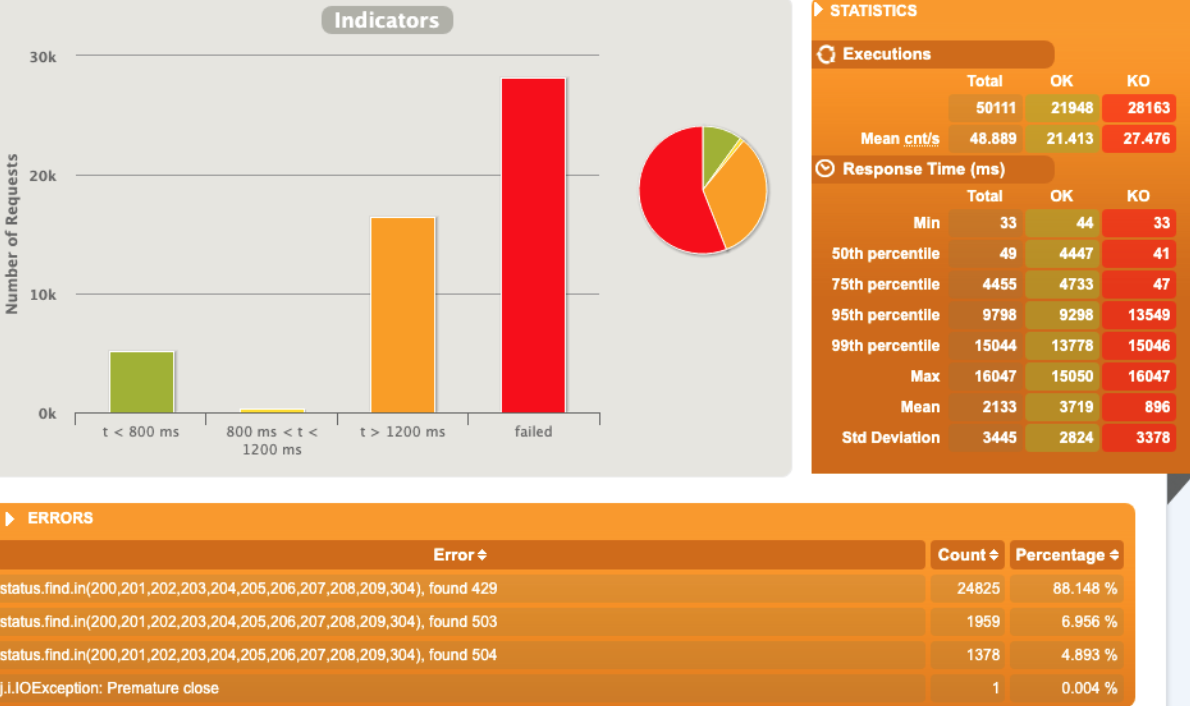
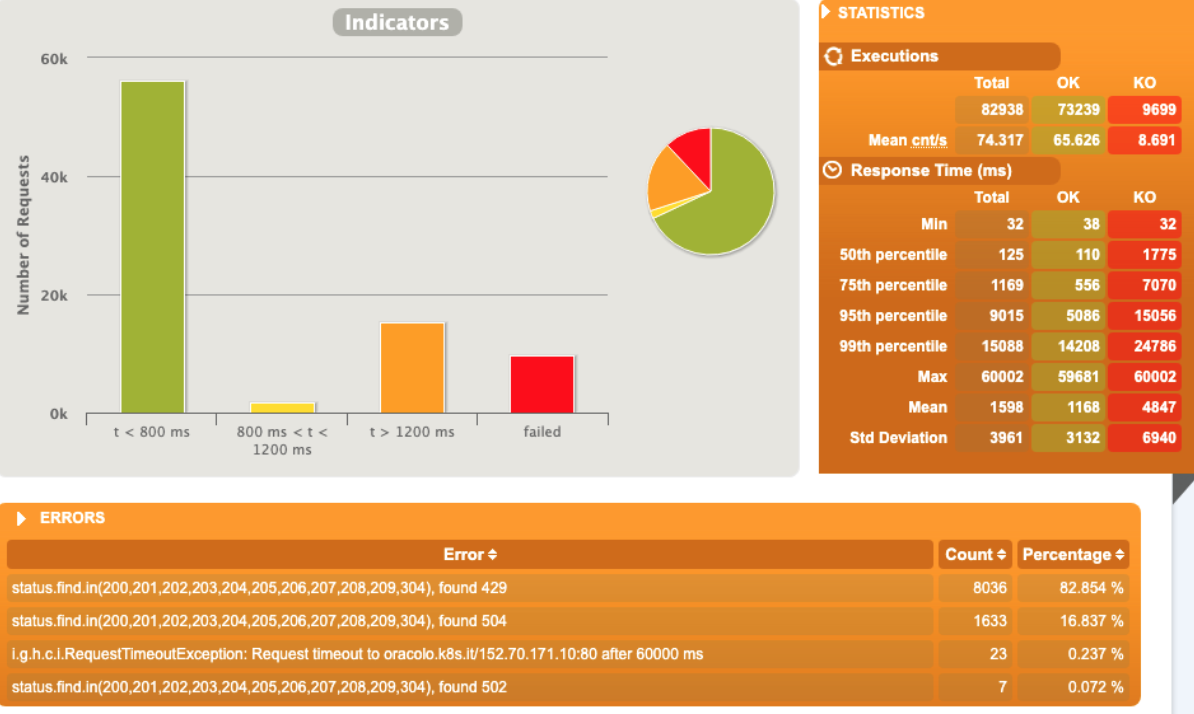
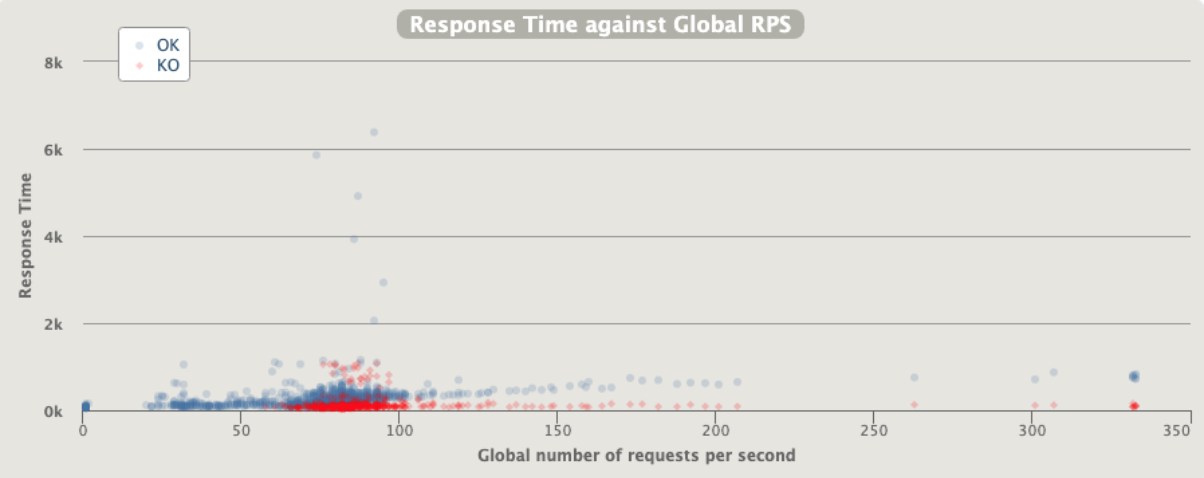
1 pod start - hpa 33rps - 15 min - 99 max requests
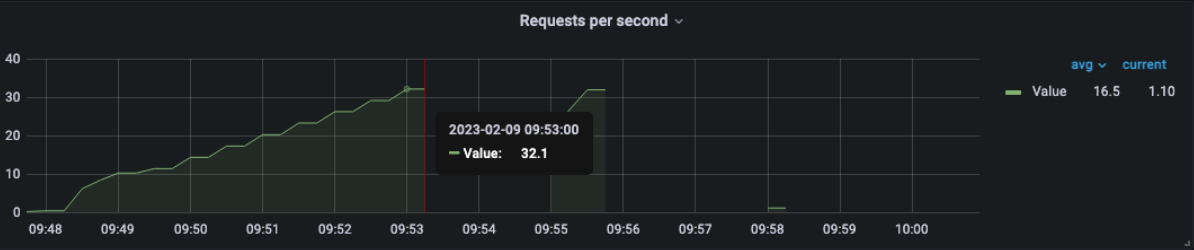
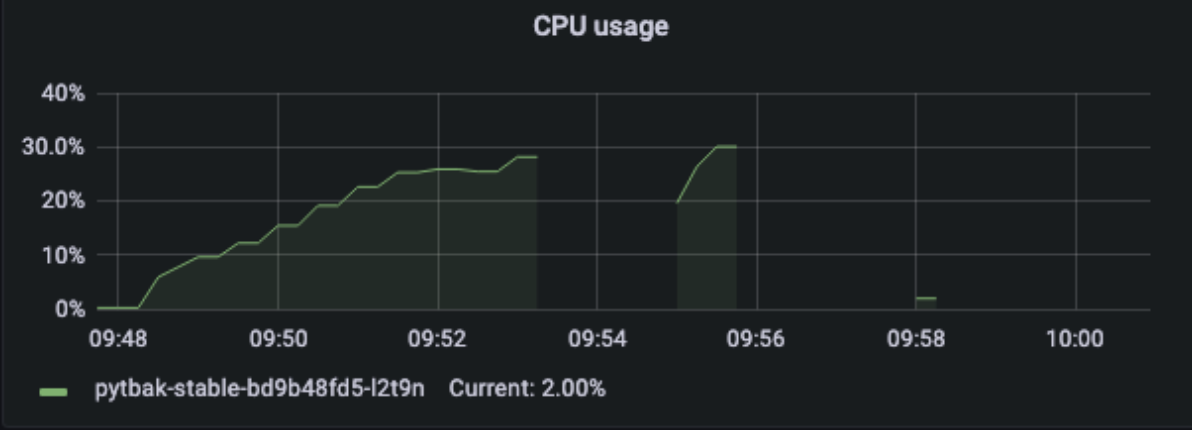
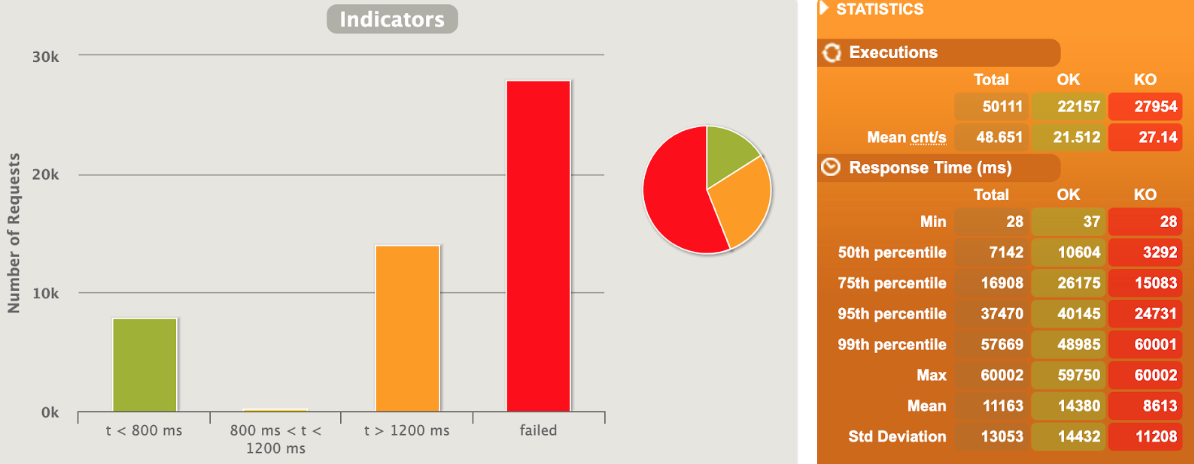
DEAD !!!
Test stopped as per ...
================================================================================
2023-02-09 10:01:38 885s elapsed
---- Requests ------------------------------------------------------------------
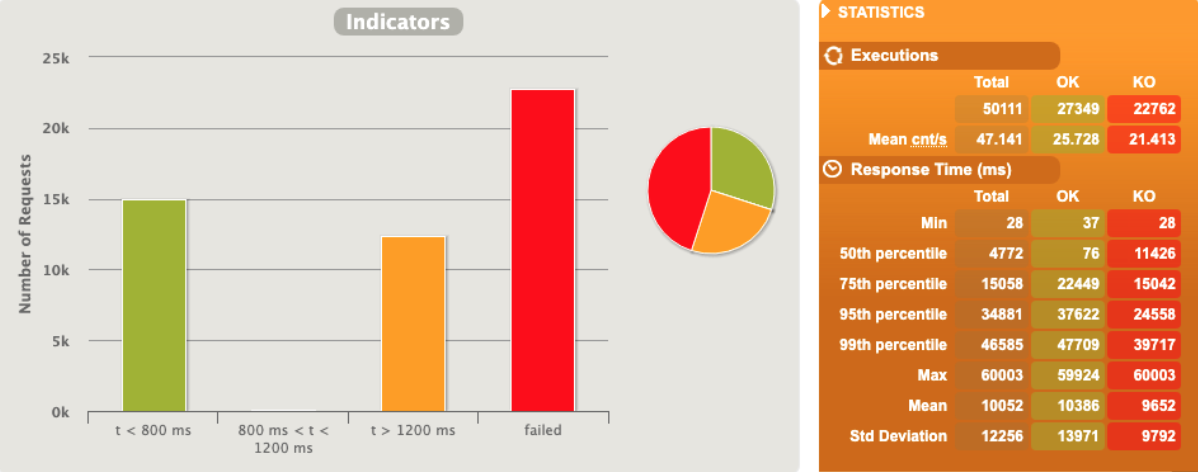
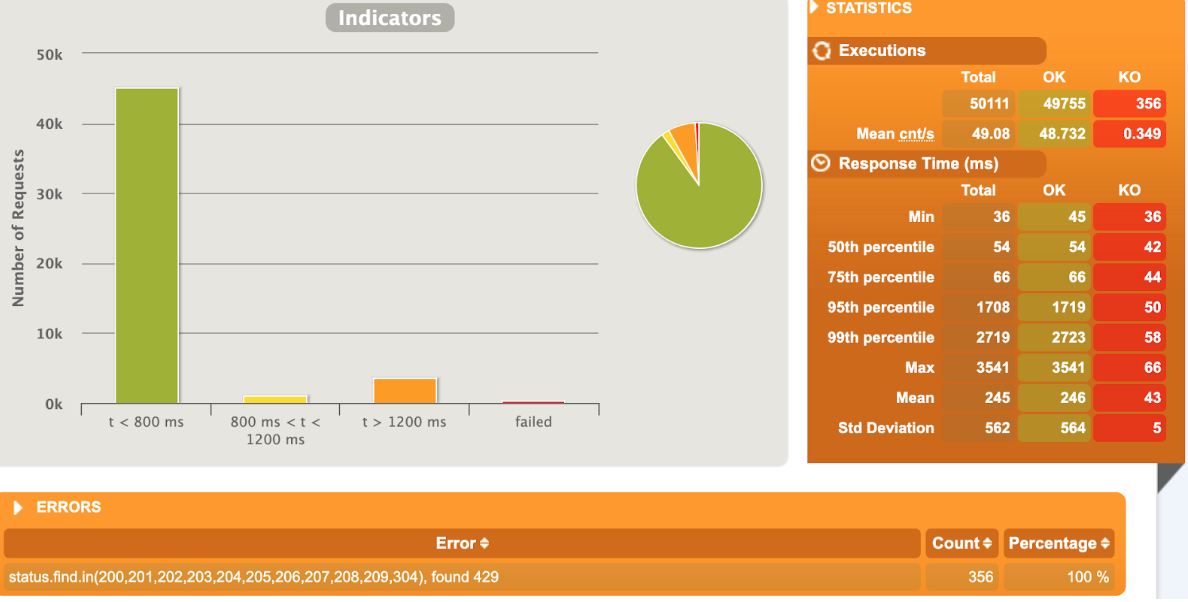
> Global (OK=17944 KO=18236 )
> request_1 (OK=17944 KO=18236 )
---- Errors --------------------------------------------------------------------
> status.find.in(200,201,202,203,204,205,206,207,208,209,304), f 8358 (45.83%)found 503
> status.find.in(200,201,202,203,204,205,206,207,208,209,304), f 5529 (30.32%)found 502
> status.find.in(200,201,202,203,204,205,206,207,208,209,304), f 4273 (23.43%)found 504
> i.g.h.c.i.RequestTimeoutException: Request timeout to oracolo. 73 ( 0.40%)
> j.i.IOException: Premature close 3 ( 0.02%)
---- BasicSimulation -----------------------------------------------------------
[#####################################################-- ] 72%
waiting: 12549 / active: 932 / done: 36180
================================================================================
2 pod start - hpa 33rps - 15 min - 99 max requests
Naaaa... still not able to scale
1 pod start - hpa 30rps - 15 min - 99 max requests
Ok we are able to scale but at the end we have a complete crash
1 pod start - hpa 27rps - 15 min - 99 max requests
Oh noooo ... worse than before with fewer rps ... since we are over-stressed when start to crash can have weird behaviour
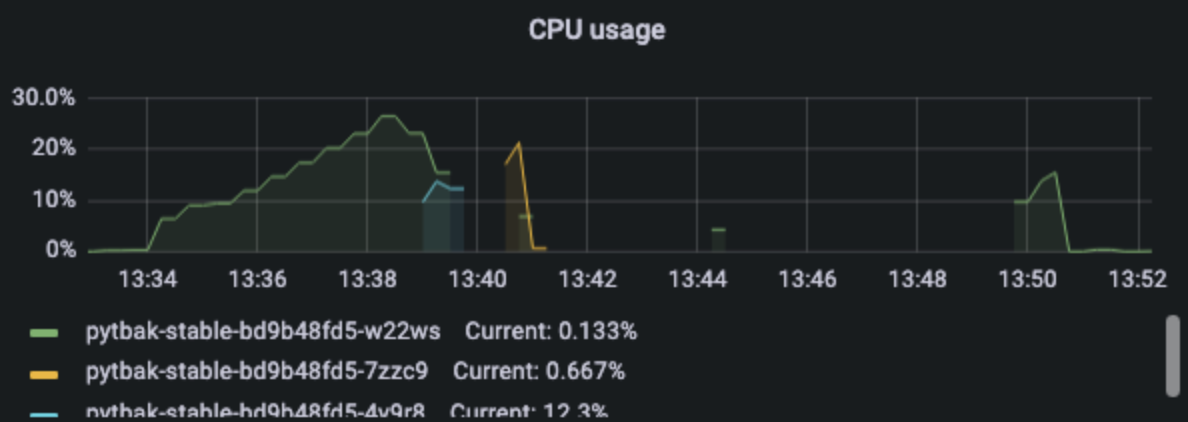
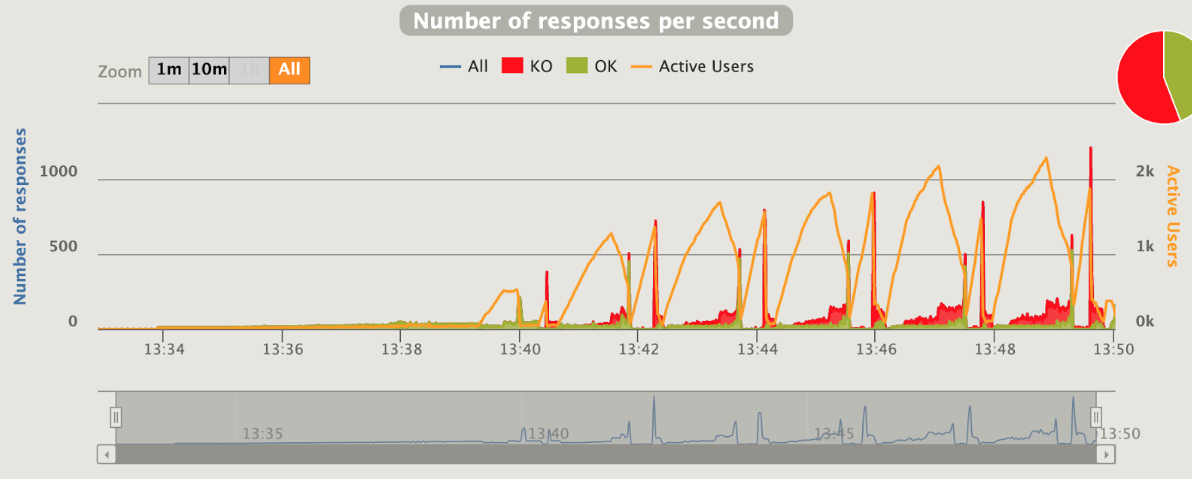
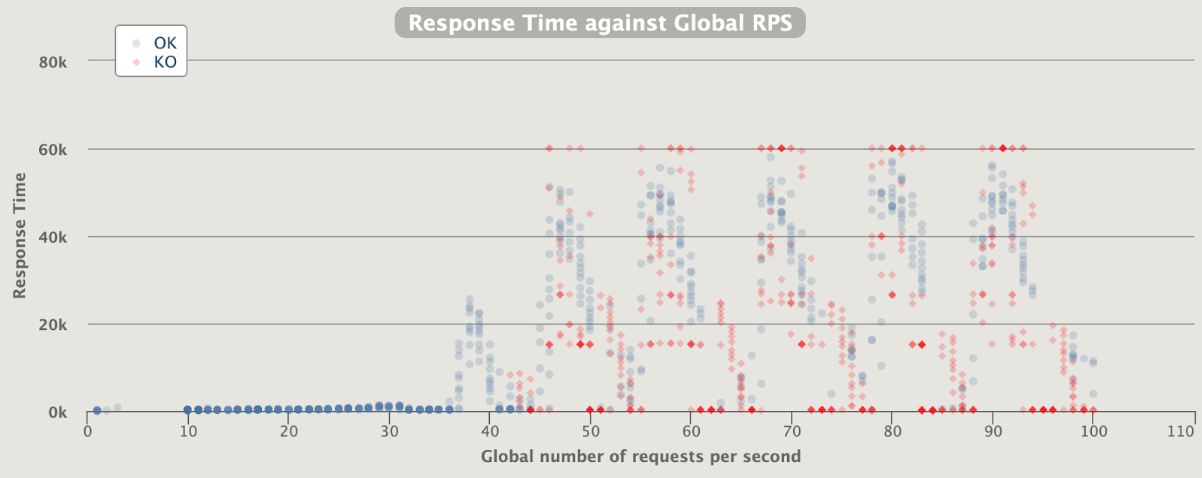
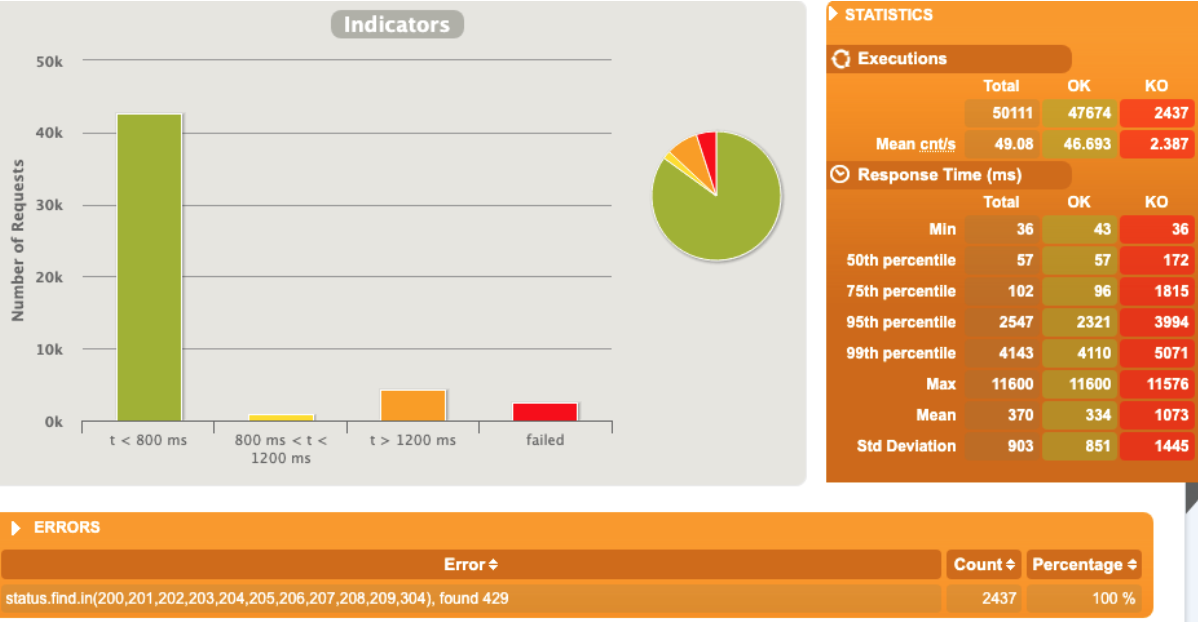
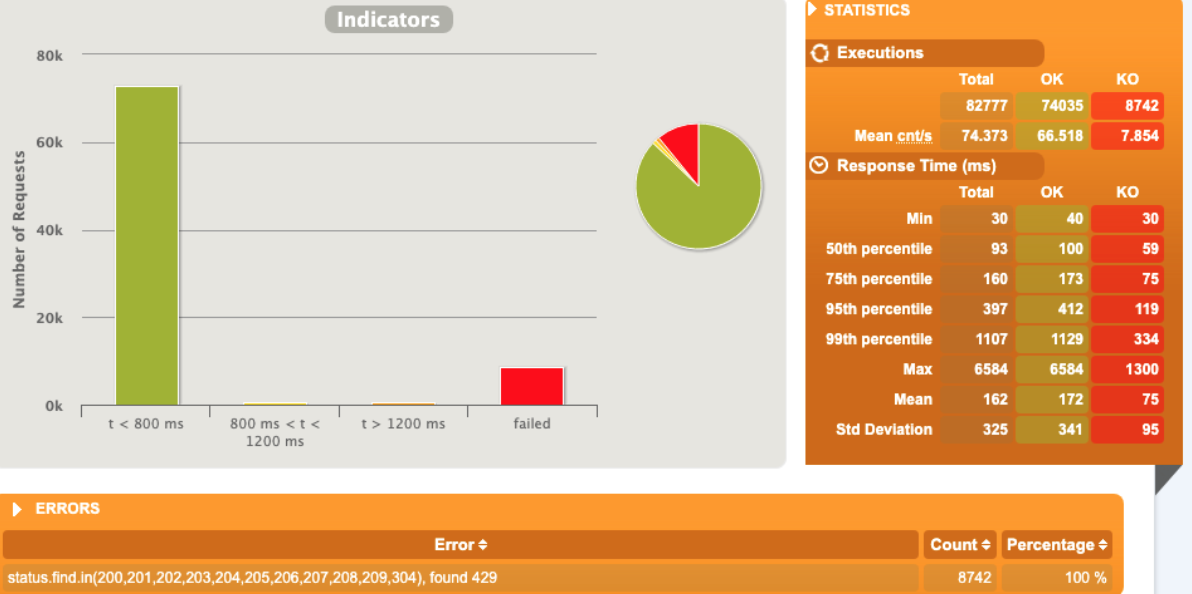
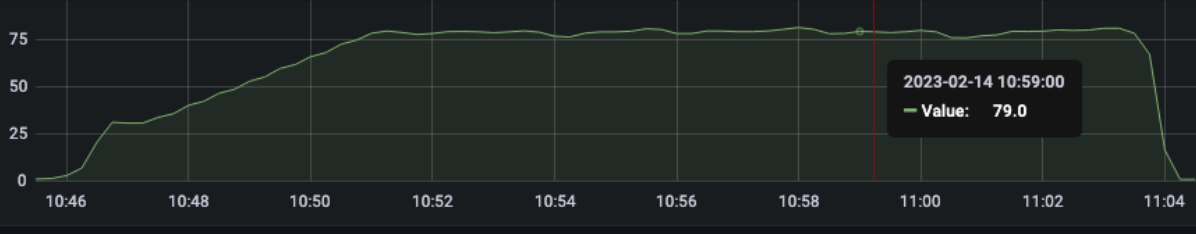
[optimal] 1 pod start - hpa 24rps - 15 min - 99 max requests
Here we are !!!
1 pod start - hpa 25rps - 15 min - 99 max requests
let's try with one more
Naaaa .... no more than 24 rps
AUTOSCALING Internal rate limit
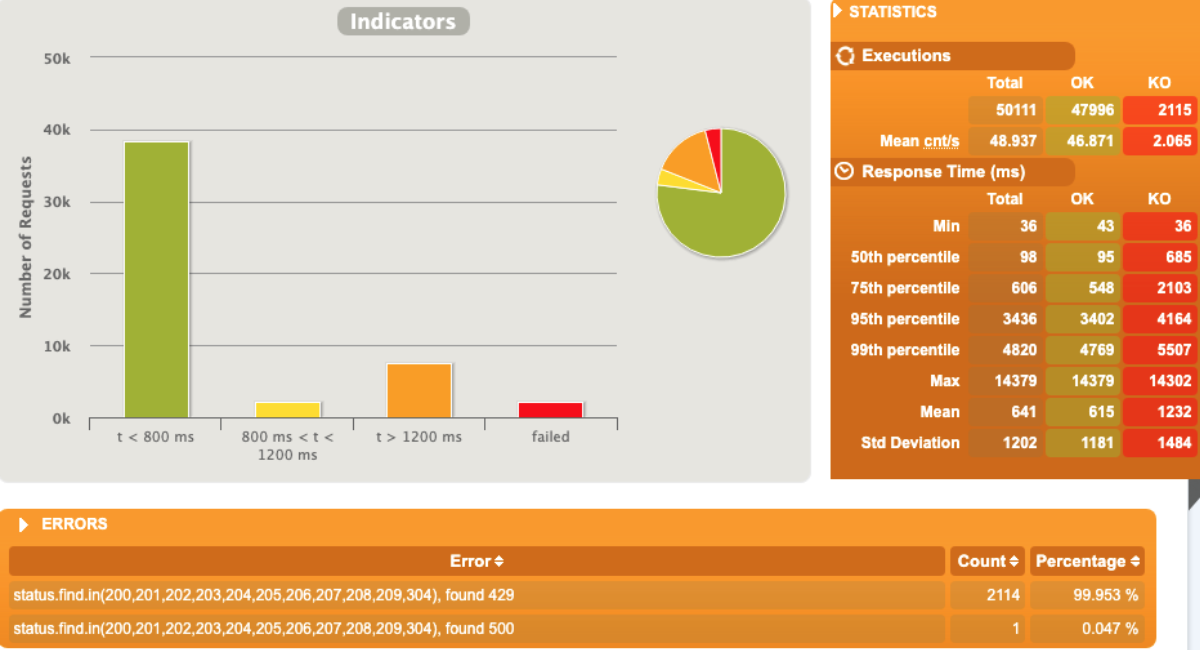
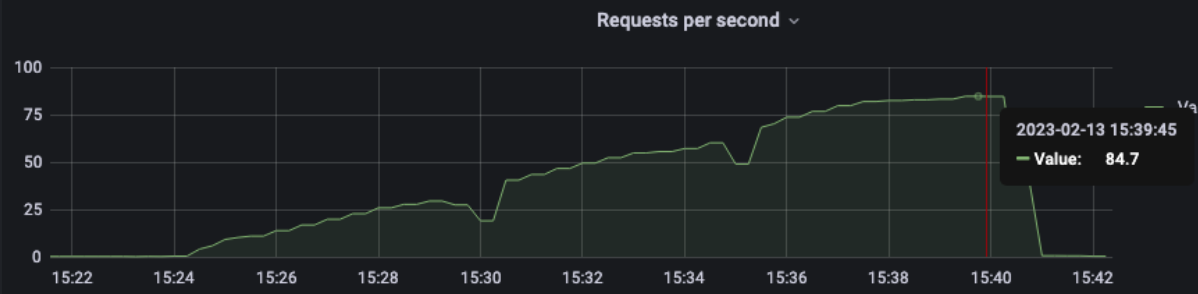
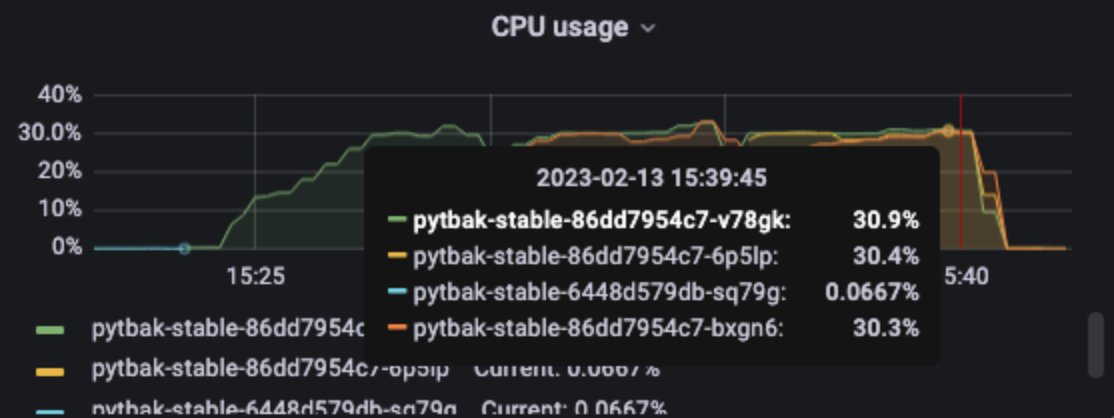
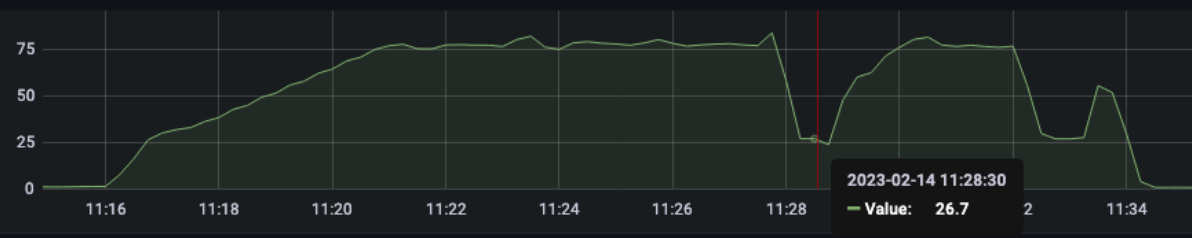
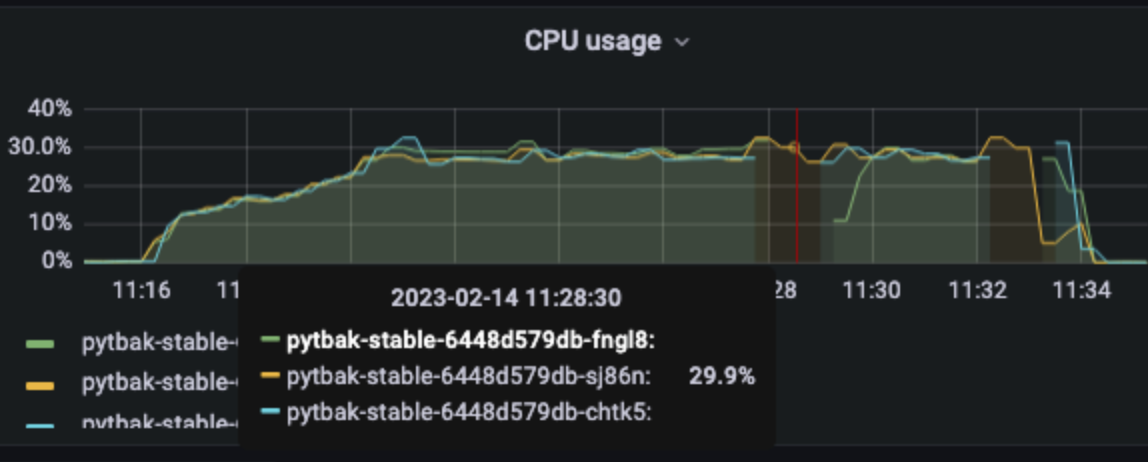
[optimal] 1 pod start - hpa 25rps- 15 min - 99 max requests rate-limit 27
I suppose that the optimal before (24rps) is working good also with RL so let’s start with 25
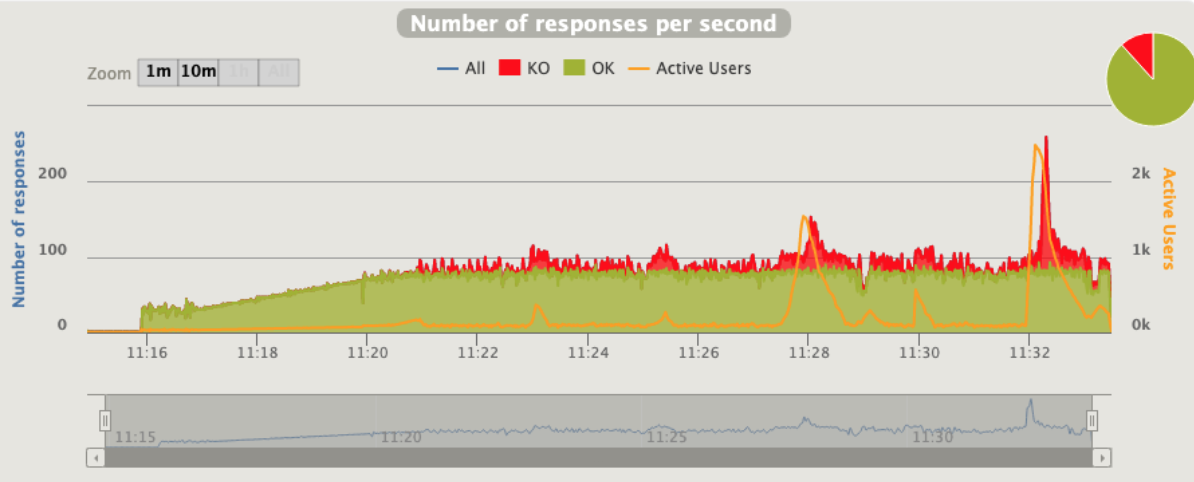
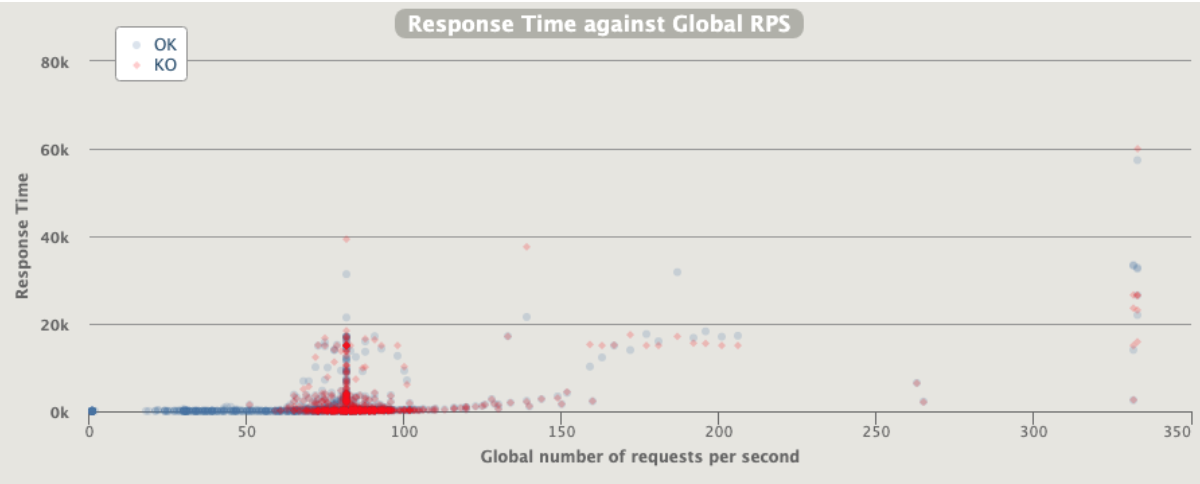
Better than the same rps with no ratelimit
The errors are just the 429 triggered by rate limit … so the good answer are ok and no issue or restart on the application during the autoscaling… a bit of queue
No so bad considering the errors in red as just rate limited calls
1 pod start - hpa 26rps - 15 min - 99 max requests rate-limit 28
Just one error for pod unresponsive
1 pod start - hpa 27rps - 15 min - 99 max requests rate-limit 29
Broken!!!
AUTOSCALING envoy rate limit
1 pod start - hpa 27rps - 15 min - 99 max requests rate-limit 29 - envoy
Broken!!!
[optimal] 1 pod start - hpa 26rps - 15 min - 99 max requests rate-limit 29 - envoy

Better than expected compared to the solution with rate limit embedded
Unexpected traffic
rampUsers(30).during(60.seconds),
constantUsersPerSec(30).during(60.seconds).randomized,
rampUsersPerSec(30).to(82).during(4.minutes),
constantUsersPerSec(82).during(120.seconds).randomized,
rampUsersPerSec(82).to(170).during(10.seconds),
constantUsersPerSec(82).during(120.seconds).randomized,
rampUsersPerSec(82).to(130).during(20.seconds),
constantUsersPerSec(82).during(120.seconds).randomized,
rampUsersPerSec(82).to(210).during(30.seconds),
constantUsersPerSec(82).during(120.seconds).randomized,
constantUsersPerSec(333).during(2.seconds),
constantUsersPerSec(82).during(120.seconds).randomized,
constantUsersPerSec(333).during(10.seconds),
constantUsersPerSec(82).during(80.seconds)
3 pod start - hpa 26rps - 15 min - 82 avg requests with spikes - rate-limit 27 internal
Since the incoming requests are absorbed from the app we reach the limit
Errors are not only 429 as rate but 5xx
Broken!!!
[optimal] 3 pod start - hpa 26rps - 15 min - 82 avg requests with spikes - rate-limit 27 - envoy
No issue at all , since the rl is performed by envoy the python app has no “spikes”
Conclusions
HPA
This application is cpu bound … so I used req/s even if the right autoscaling metric is the cpu usage, however, I would say that each application has the intent to serve requests.
Create a dedicated configuration, application per application, for the hpa is the best option but it requires HUGE know-how and time …
Considering the sentence before, I was impressed about Active users since share the correct clue at high levels about the status of the application, it’s really really close to measuring the enervation of the app
I would say that the concept of active users as a HPA metric is better than flask_http_request_duration_seconds_count
Even if we can reach 33rps in a single pod , we should consider that in an autoscaling scenario this will be reduced to less, cause for a certain amount of time we have more requests till we are waiting for new pods/node etc etc
I would say that is better to have an application running at 65% of max capacity before scale
Rate Limit
- Understand how much we can close with the application enervation during an autoscaling situation using rate limit
No … or better … we can increase a bit the limit to exploit the app at max possible, however, it’s just a risk for 5% more in rps.
The application will be more sensible and the rl is really close to the hpa
- Understand how to handle unexpected traffic with a rate limit
Yes … this pattern is the right one for the rate limit
Better is to perform this action outside the application container since will impact unfortunately the incoming requests, the saturation etc etc and you have rl and hpa that can fight each other
Both
- Do not force hpa to collaborate with rl … should be 2 different parameters
In this scenario are both rps ... but are profiled in a different way , so do not consider as the same metric or meaning
Costs
In some way trying to save money by increasing to the possible max rps is risky, we should leverage the kubernetes pod scheduling more than try to reach 100% of the application
Highlights
Unexpected traffic can be something that is generated for a wrong deployment/batch 5% of cases or by external calls 95%
The external calls come from public or private endpoints can be managed by
- waf rate limit
- api gateway rate limit
Those two solutions are better, cause they can keep the infrastructure safe as a first point of contact but ... A big BUT
In a dynamic infrastructure where we have autoscaling and downscaling, a legit peak like google scrape is not possible to handle, cause the RL is service level
AND…
during the night, it's supposed to have the minimum pods available as there is less user traffic for example.
So … I’ll remark on the drawback of cost savings following the matrix based on hpa patterns (cit brewster's millions)
As much as we are close to using fewer resources as possible, as much we are increasing corner cases and unexpected situations.
Be careful to evaluate the rate limit concept
Cheers :-)