The monitoring paper

Contrary to popular belief, monitoring an infrastructure is the opposite to just have some metrics about applications and network
There are many many documents the lead this topic,
one of the most interesting it's just few pages from Google around the art of slos
or the book version i took from a google onsite deep dive.
To better details this topic i'd like to use simple statements:
- WHAT
- WHY
- WHO
- HOW
WHAT
This is probably the main argument we will discuss on this thread
There no magic formulas or tools to use, if you expect to buy a tool that work with metrics out of the box, you're wrong.
Tools are the infrastructure to store and visualize data... but first of all you need to collect the right data.
What is the DATA you need ?
Those are you will record moving yourself on the customer position
Customer position : i'm using this term because i suppose you are not an onlus so you have a customer, but customer is a overall word with the meaning of all people are using your product:
- people that buy something e-commerce (Amazon, Bestbuy, Aliexpress)
- people that use website to learn something (Cnn, Bloomberg, Wikipedia)
- people that work on finance and use finance applications (Navision, SAP, JD Edwards)
- people that use energy from nuclear site
So moving yourself on the customer position you can better understand the definition of data that you need to know to better monitor your application with the righe customer metrics
Stupid example ... imagine an automatic gate

What is the definition of "it's working?"
- it opens
Obviously YES , but not only
- what about if it's not closing ?
- what about if it opens in 10 minutes , it's acceptable ?
- what about if after X times the automation is broken ?
- etc etc ...
As you can imagine we can define not only the objective values (open/close), we can elaborate customer subjective frustration , if i have to buy an automatic gate, i will not choose the one that will take 10 minutes to open... because... because 10 minutes are too much , based on subjective value as a customer.
In the same way we cannot say that our application is working because it's answers.
So what we have to consider when we start to monitor an application in production?
Let's start with 3 macro clusters:
- system resources, so all metrics related to the pod (cpu,network,...)
- application standard metrics (thread, gc, errors per minute, requests per minute, ... )
- business metrics that are inherent from the application scope, if the application provides a checkout for goods, we need to know for example how many transactions were fine and how many rejected
System
Those are the most easiest and used metrics since you started to monitor services.
On this group we have the basis metrics related to the system usage,
considering the evolution of the platform those values are day by day less influential than before.
This is because as soon we are increasing the technology level from bare metal, to vm , to docker to serverless ... the evaluation of those numbers could raise some mistake on the interpretation , however we still need to start with the basis in order to have data to define a trend based on specific situations
Here an example about the bare metal used as vsphere 6.7
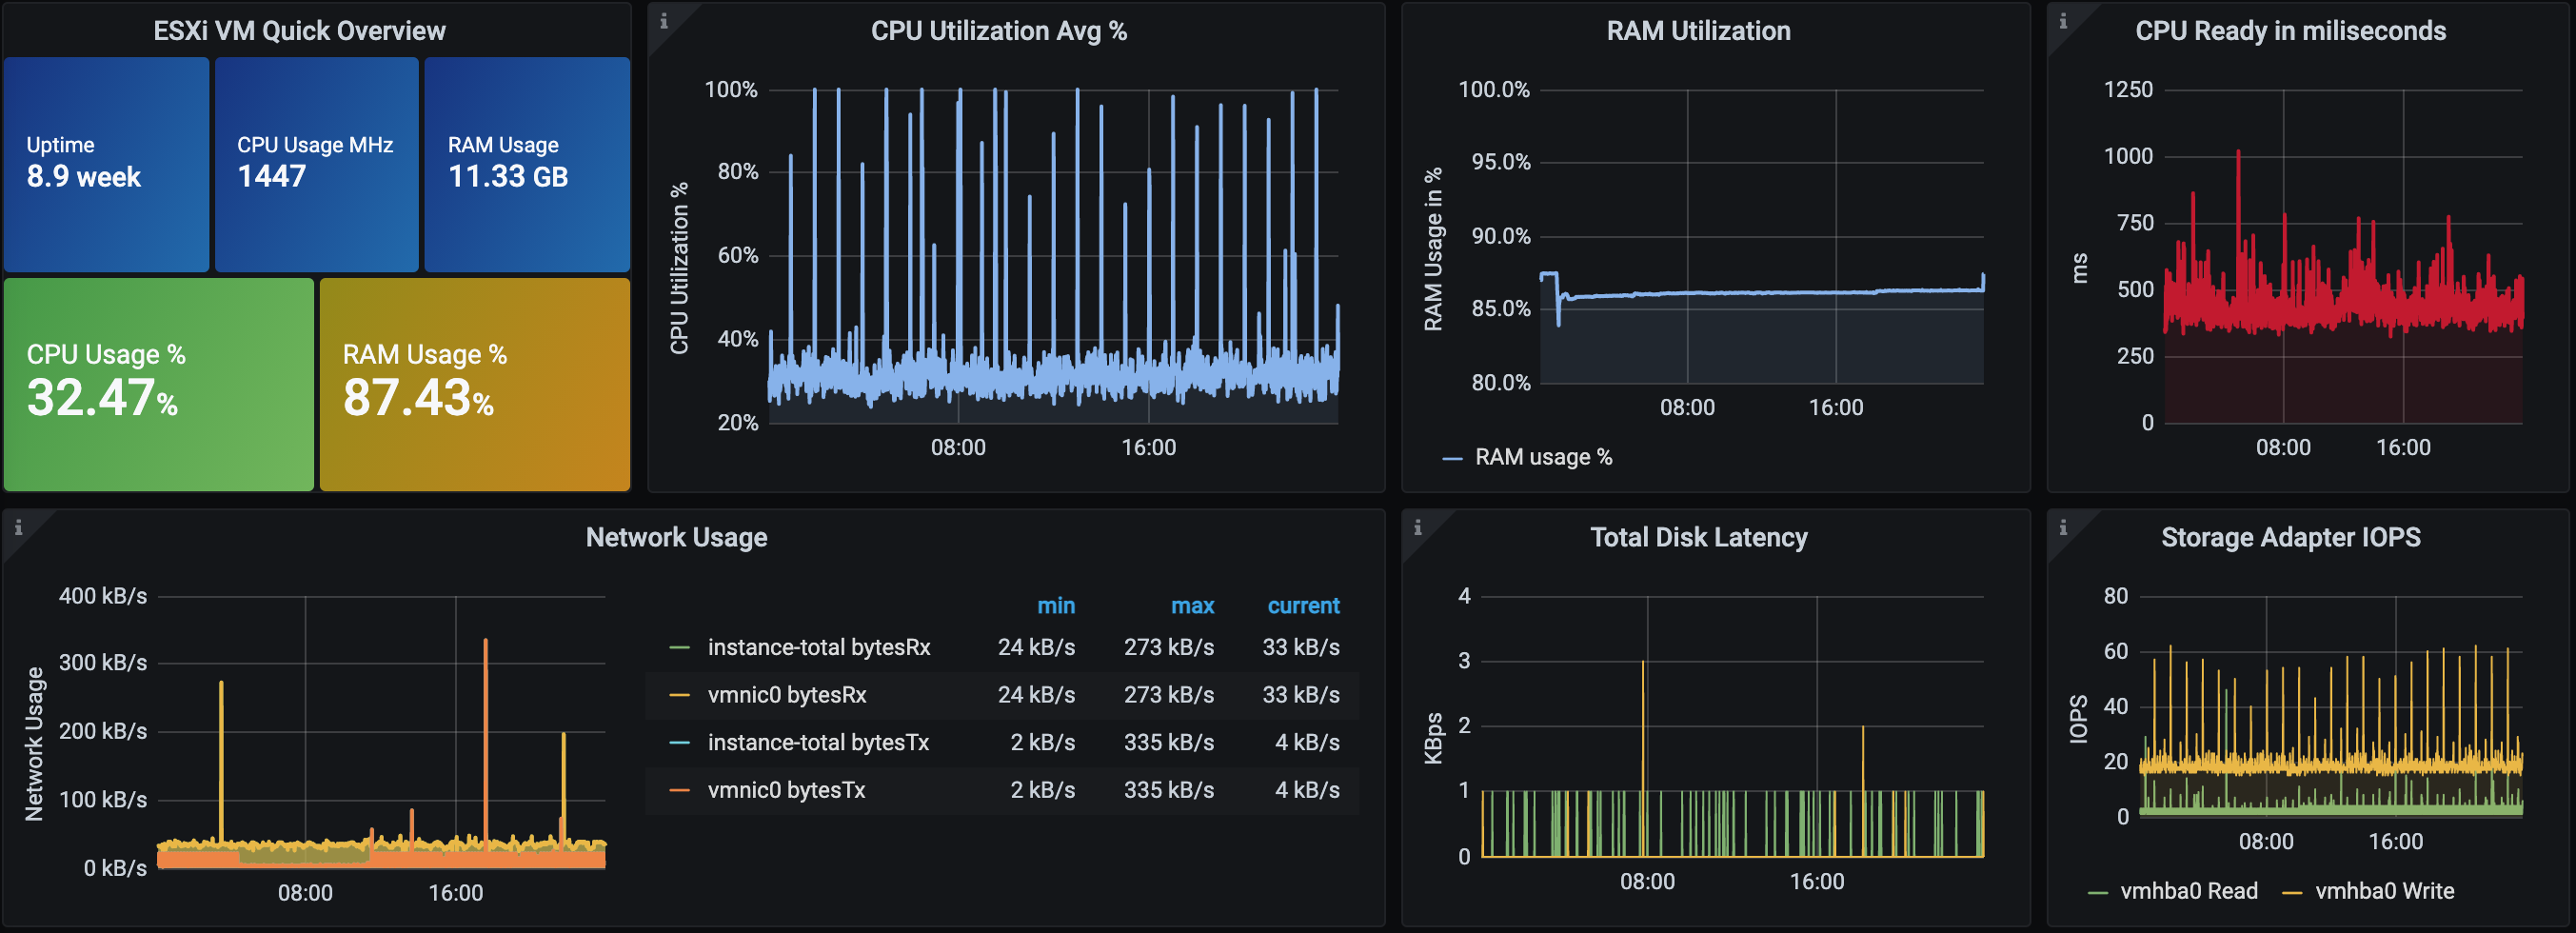
always on the system metrics we can go more in deep checking a virtual machine inside this host, here the one i used to host my kubernetes lab
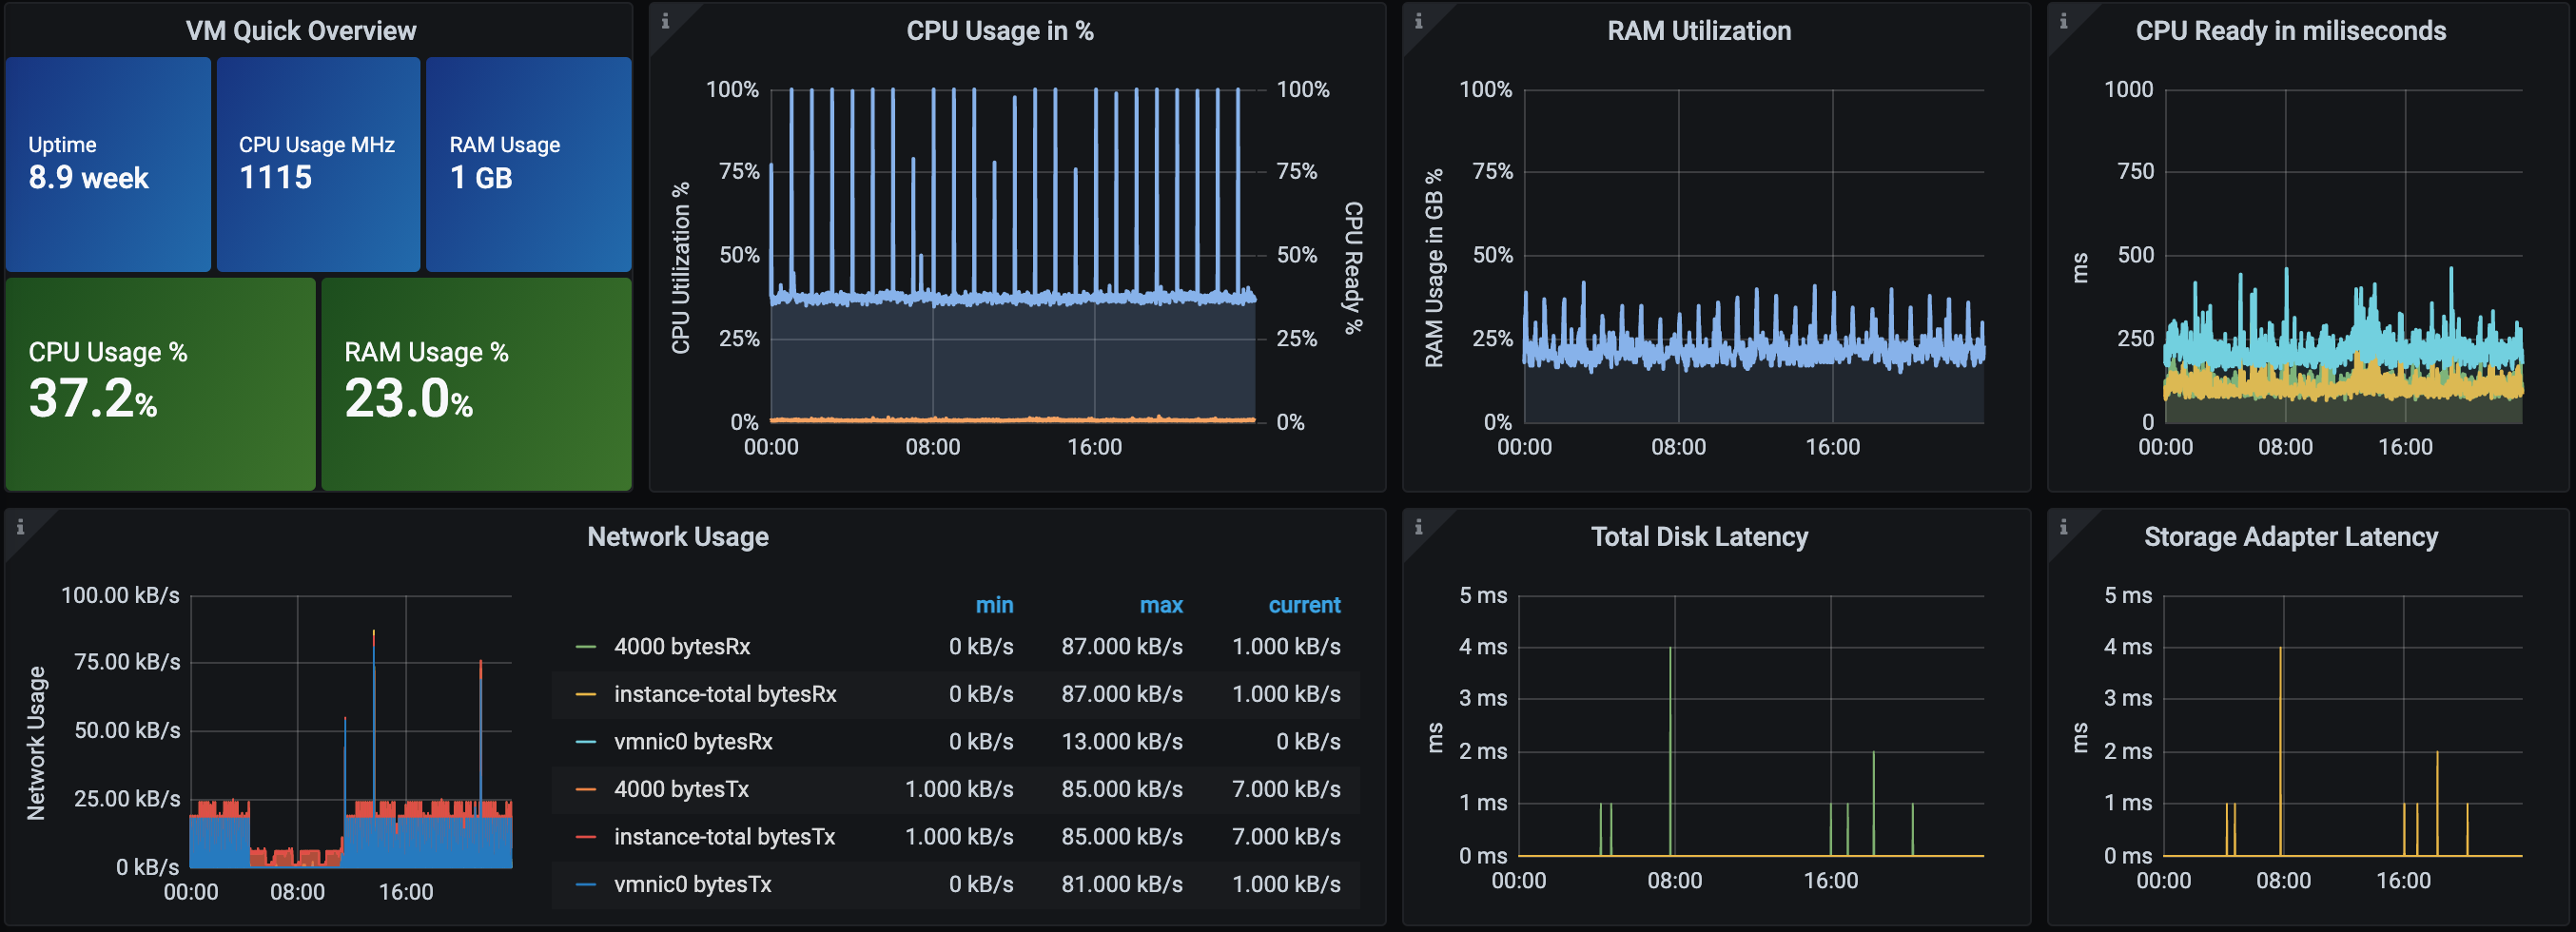
In the 2 images for example we can assume that we have something that move the cpu close to 100% cyclically (it's a crawler to perform check on website pages every hours)
Application
It's time now to move inside the kubernetes cluster and check how is going on the a web application inside the cluster
Since this application it is springboot based, we have the opportunity to understand how is going on from a framework side (java) and behavioural interactions.
Response time server to server, server errors, client errors, sql interactions, garbage collector, sidecars (is a pod with multiple images) usage, logs creation , metrics creation etc etc
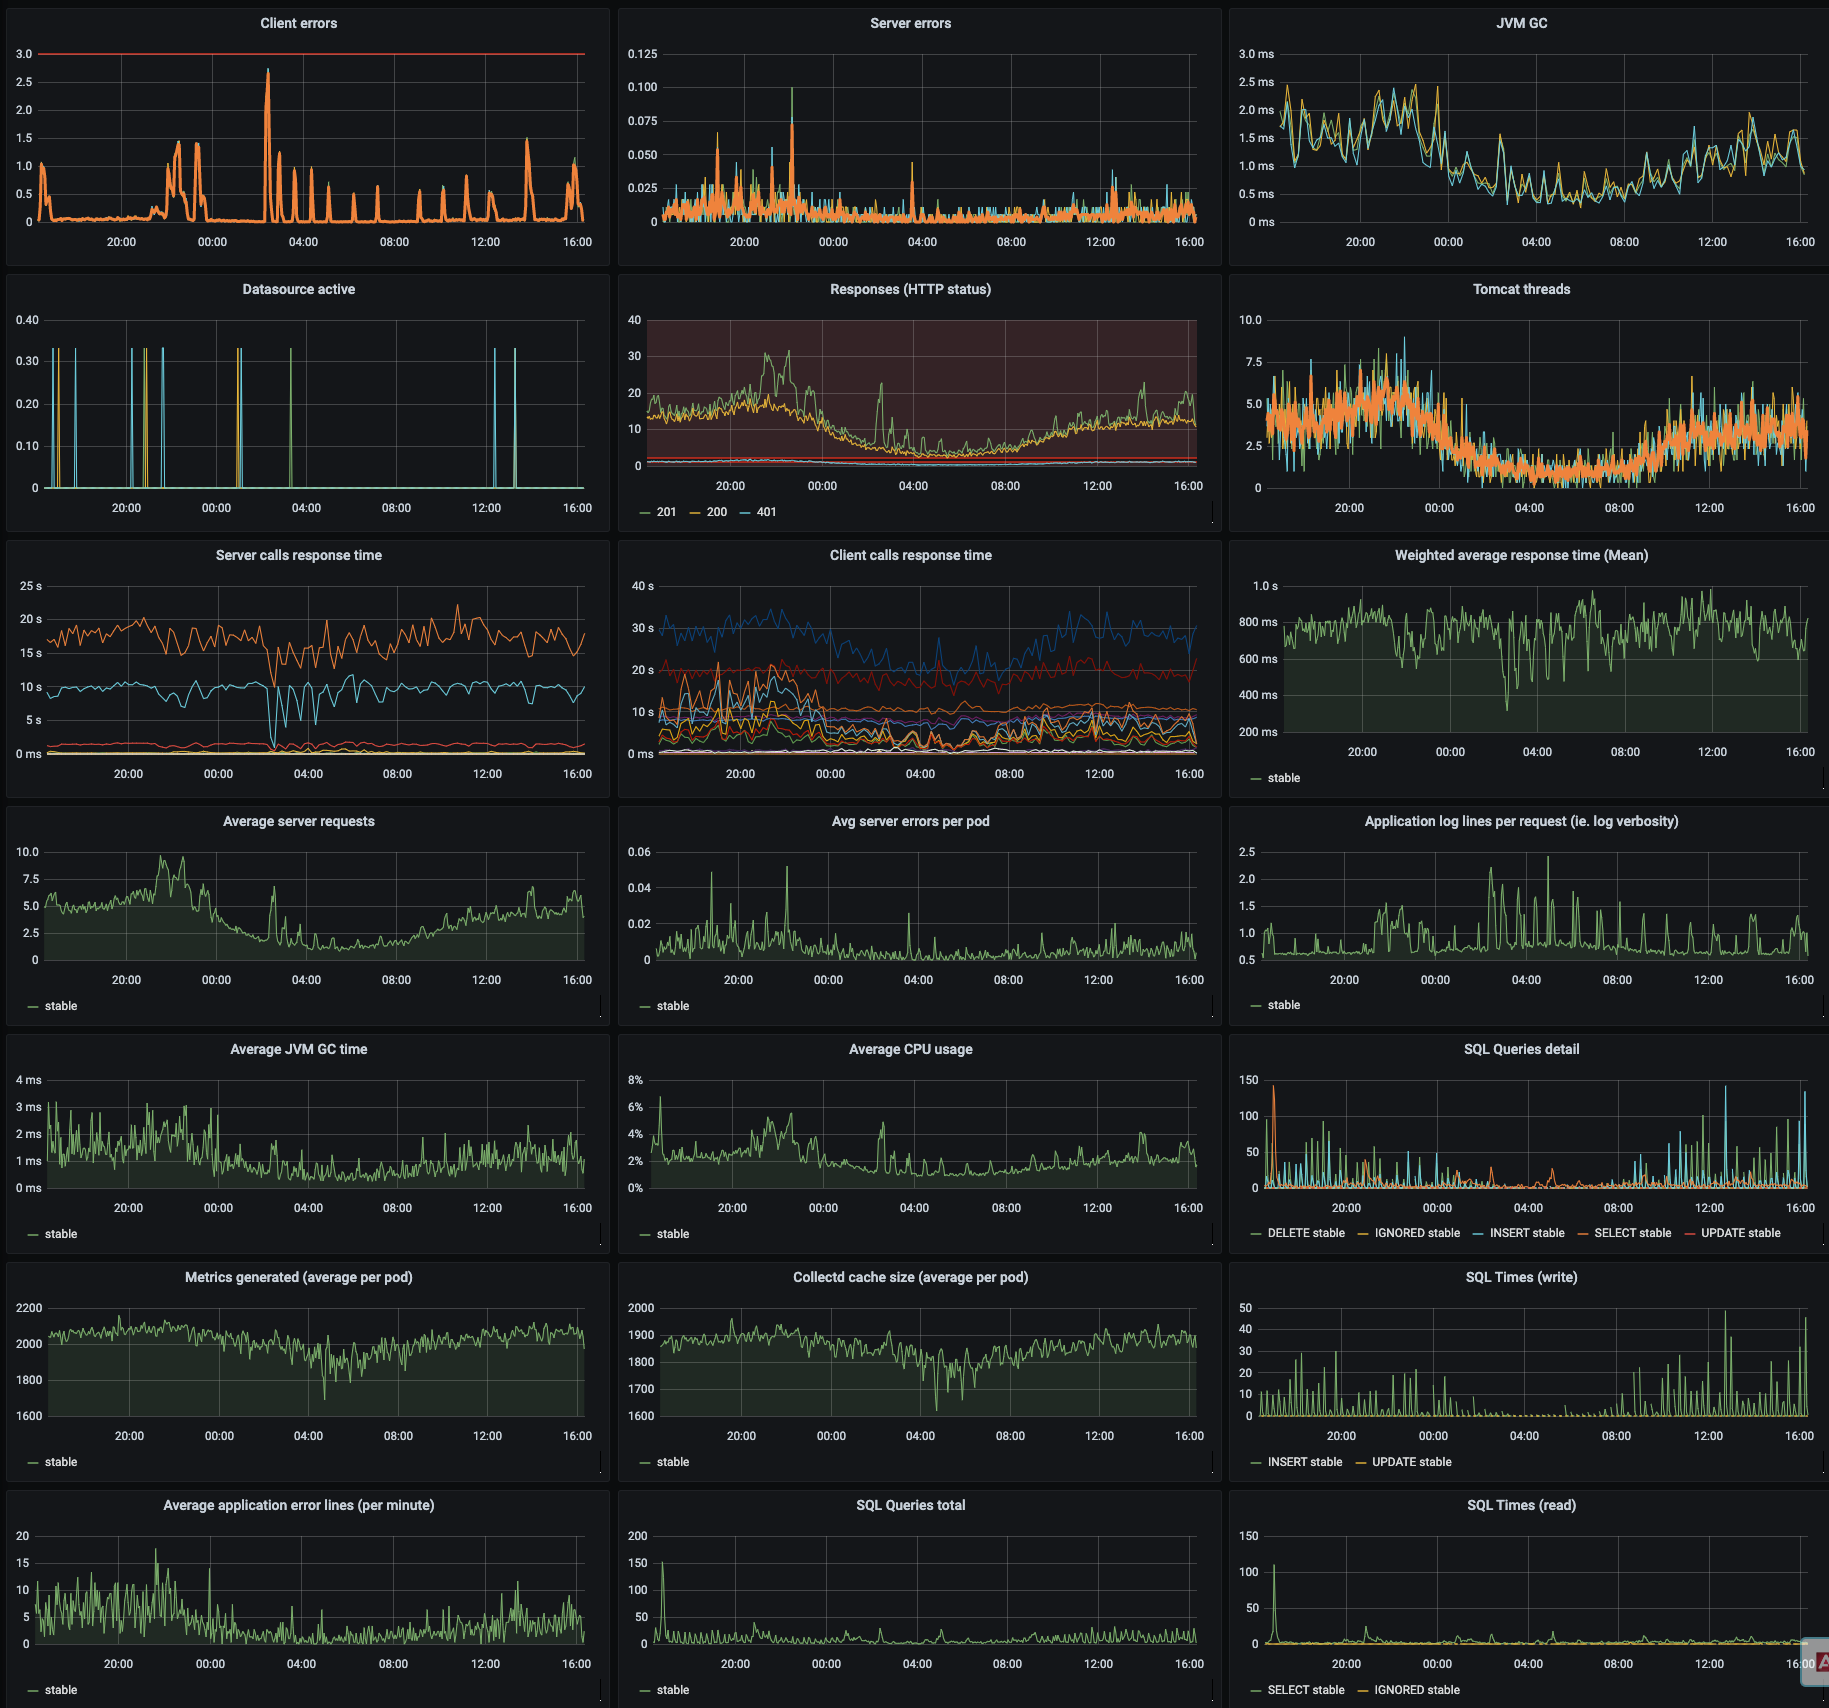
Having those in place you can understand from an application point of view how is going on the performances release by release.. what happen in case of bugs and critical condition (unexpected huge traffic) , the area where you can put you effort on improvements.
Business
OK system is covered , application is covered ... what about the customer perception ?
This is the most critical topic , if your application is part of a microservices funnel or a monolithic application that manage the entire product, it's supposed that in some way you have benefits from its performances
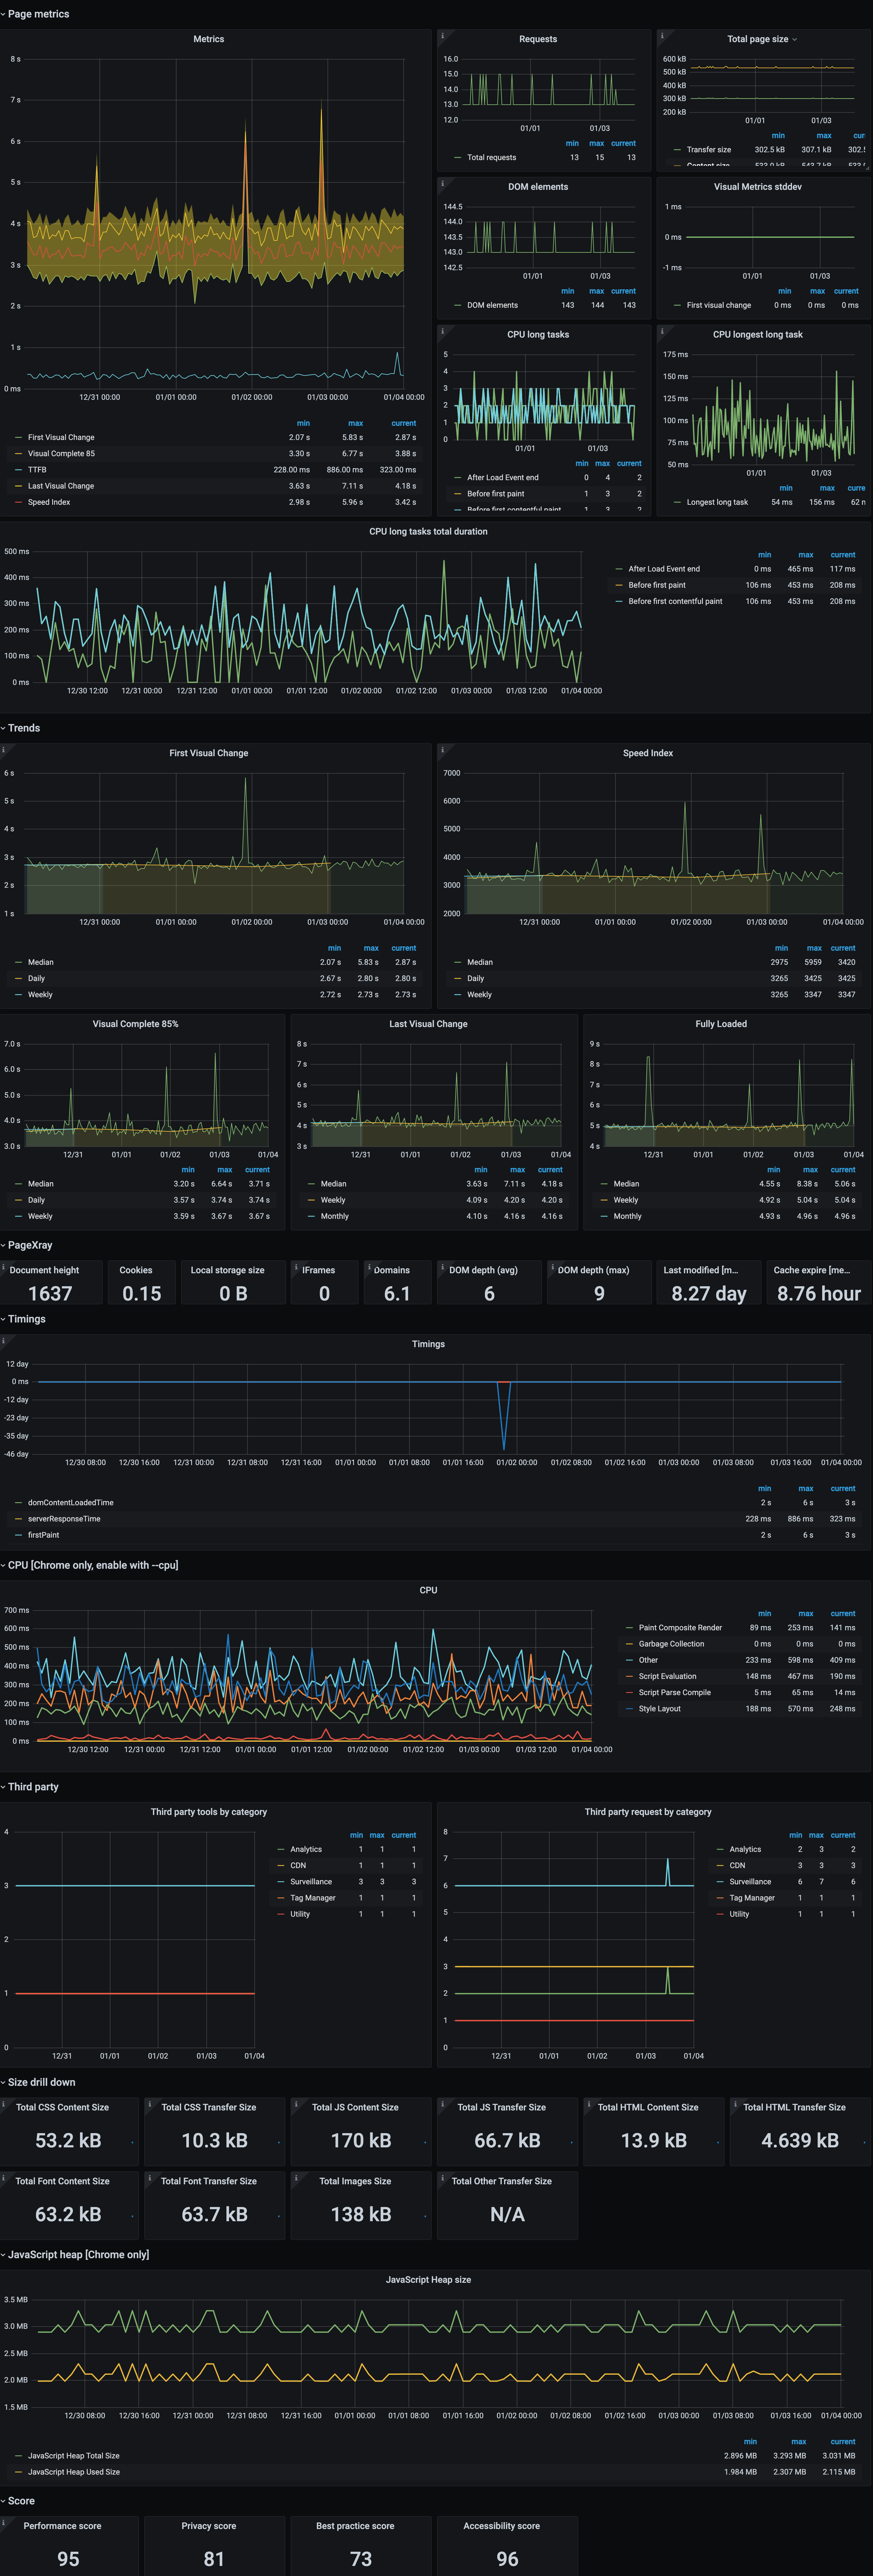
So move yourself on the customer position monitoring your website from a customer point of view with business metrics , in this simple case i just monitor the cms page on top
It's a website:
- so how long does it take have the page ?
- which are the most relevant data you need to know to improve?
- do you have the same trends every time ?
- etc etc
WHY
With those cluster of metrics we can define and plan the architecture and the forecasting for the company ... remember that when something goes wrong with no metrics you will probably cascade to situation like this

System metrics can share the usages and the density of you infrastructure creating the basis alerts in case of suffering but also plan the evolution of the platform itself
Application metrics share the framework behaviour and the evolution of your application day by day , alerts are defined to monitor the scalability, bugs and application behaviour
Business metrics share the thresholds to use as alerts but not only...
In this example we are talking about a web application
If you are selling something through it ,conversion is always the most relevant buzzword
From the 100 visitors , who will continue the navigation till the purchase, the remaining are really a small slice (e-commerce for example)
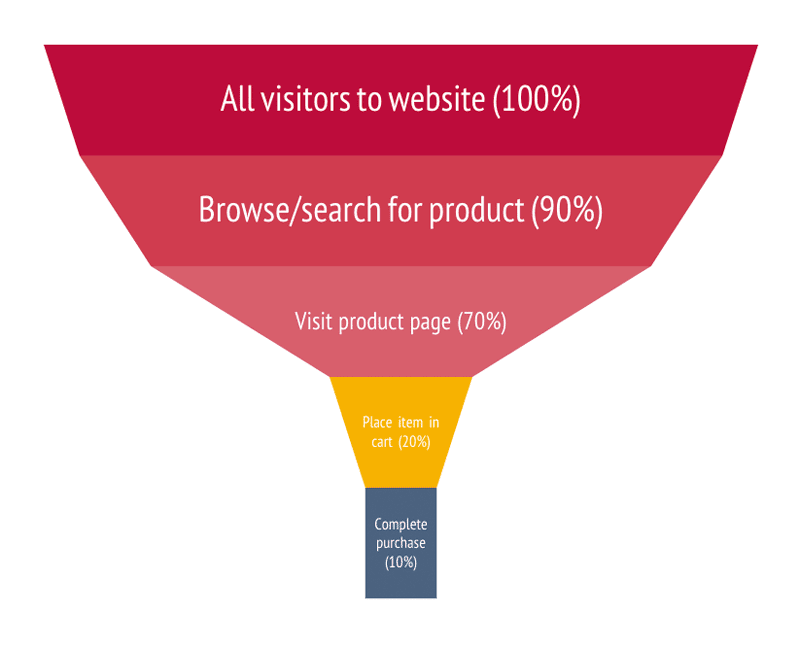
This images comes from an 2015 article from Akamai that is really still actual ...
Conversion is always impacted by page response time , more close you are in the first navigation phases like searching rather than checkout where you probably have more clear will to purchase
Now we know the data around the usage of our website and we can create GOALs and KPI to improve those values in order to better fit with the customer expectation.
WHO
Those actors could be different case by case, from a small company to an enterprise, even if you are a full stack whateverops, a developer or part of monitoring team, in this scope you should not be alone.
System and Application are usually managed by sre/devops/sysadmin with the help of architecture/developer to define the best framework metrics to monitor.
On the opposite side Business are more close with the product side, who will be better than the product dept (developers) itself defining the kpi and goals used as a metrics with the cooperation of the business dept to define the thresholds.
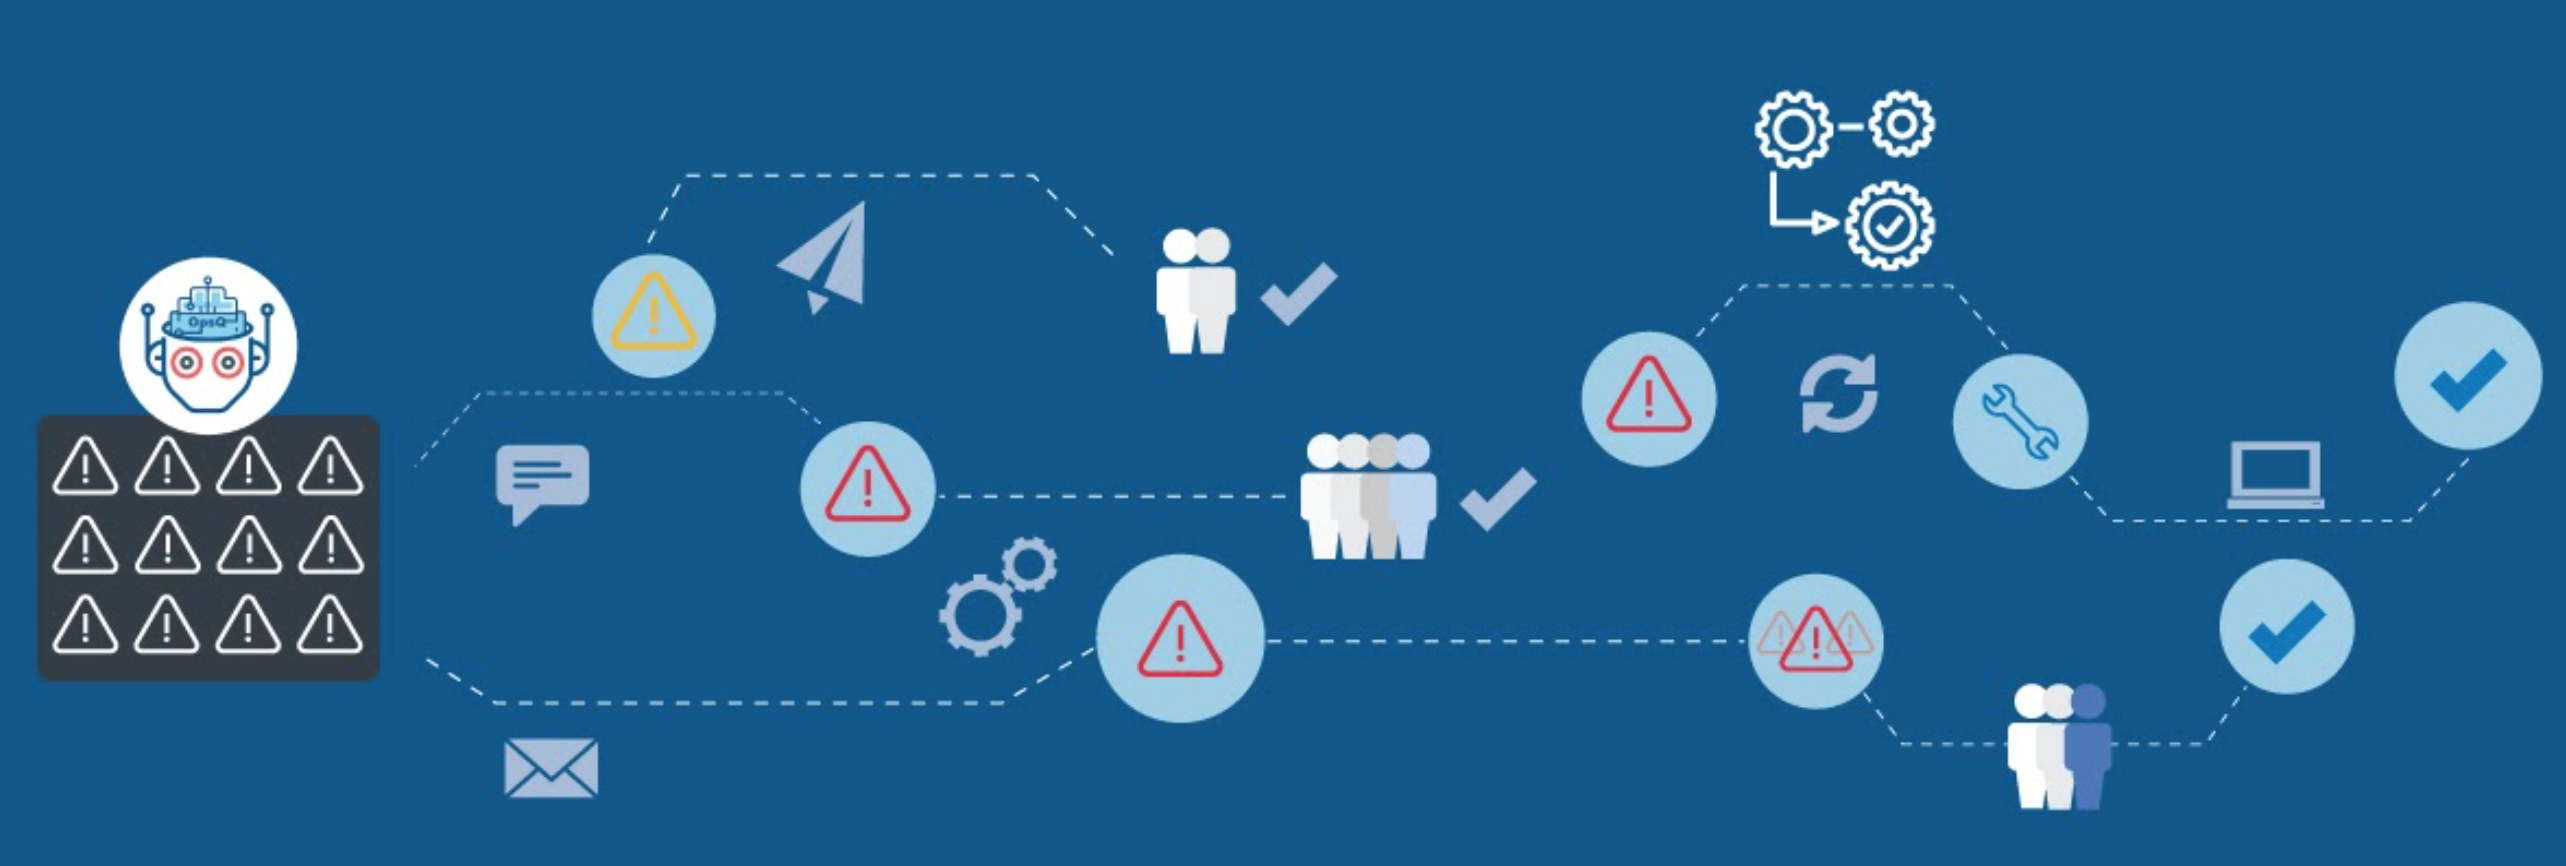
This cooperation will be useful to define:
- Right alerts to right people
- Support granted by ownership
- No speculations, real data
HOW
Infrastructure
First of all you have to define the monitoring/alerting platform,
the suggestion is to have this platform scalable with a good UI (grafana) to work with backend storage (prometheus + cortex/thanos, graphite + carbonzipper, influxdb, etc etc)
Honestly if you are in a big environment and you make a mistake in metrics configuration with graphite (push model) you can saturate the space since every time you create a new metric you are creating whisper file with the dimension based on the retention schema.
I prefer prometheus (pull model) that could prevent those issues and better fit the kubernetes standars , will be also more easy create a /metrics page on your application rather than use sidecar pods to stream metrics with collectd/telegraf/statsd and so on.
Less is more
How many metrics are enough to create a valid alert?
The more metrics identify the service behaviour the more we can create a dedicated alert...
anyway ....
The anti-pattern model currently applied in some cases:
have tons of metrics that generate only noise without identifying the healthiness of a service
Keep it simple and define the structure of your System, Application and Business metrics .
Smart metrics
It’s not only ONE value that show off the healthiness, but the combination of multiple metrics that guarantee the status

This concept is really important, imagine a dynamic infrastructure based on kubernetes HPA
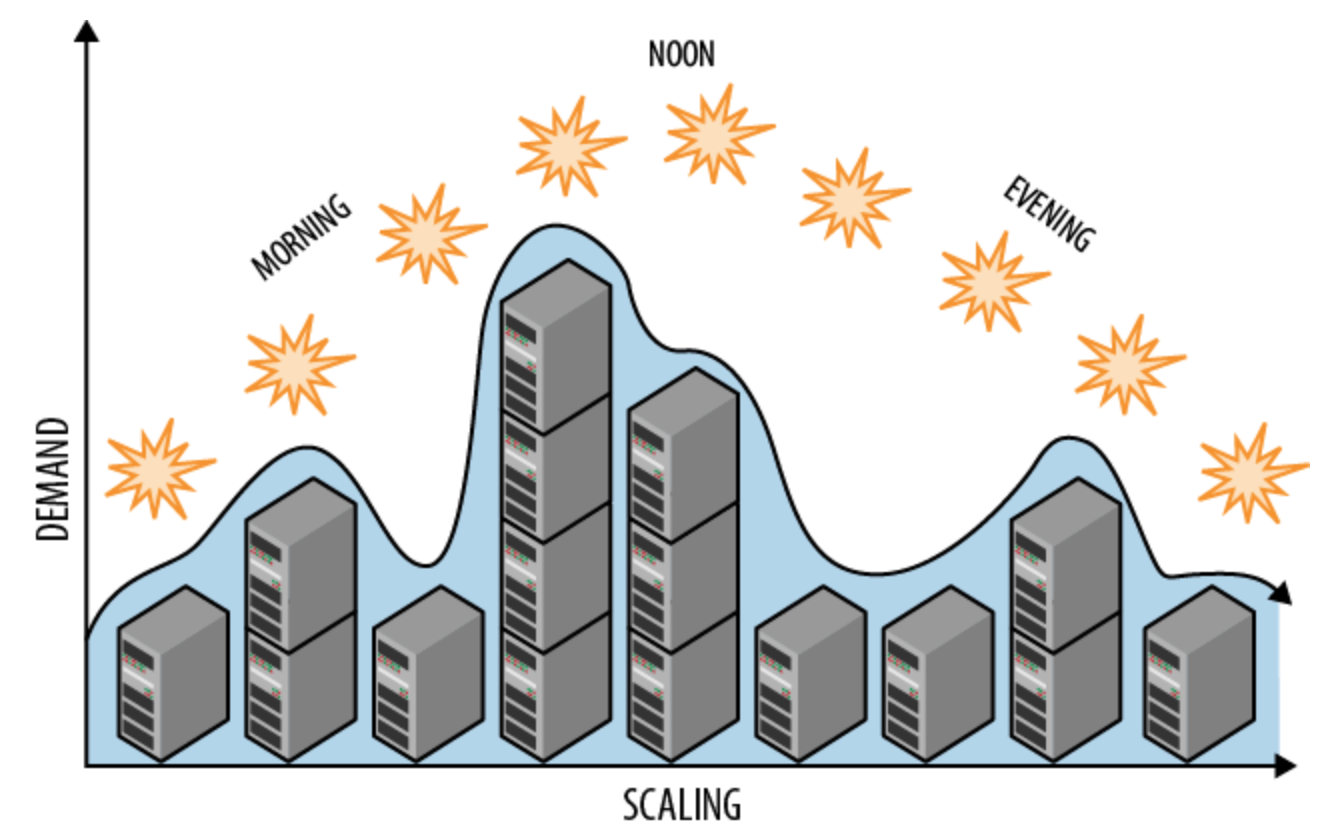
where you can probable have some value linear (like thread), mitigated by the horizontal autoscaling, you should combine multiple values to define the application status.
Create the metrics alert with trends not with the pure number
Ex. 70 threads value alone make no sense , different applications has different threads value , what is important is the delta , the percentage is useful to understand the behaviour, +50% threads make sense in all applications rather than the effective number.
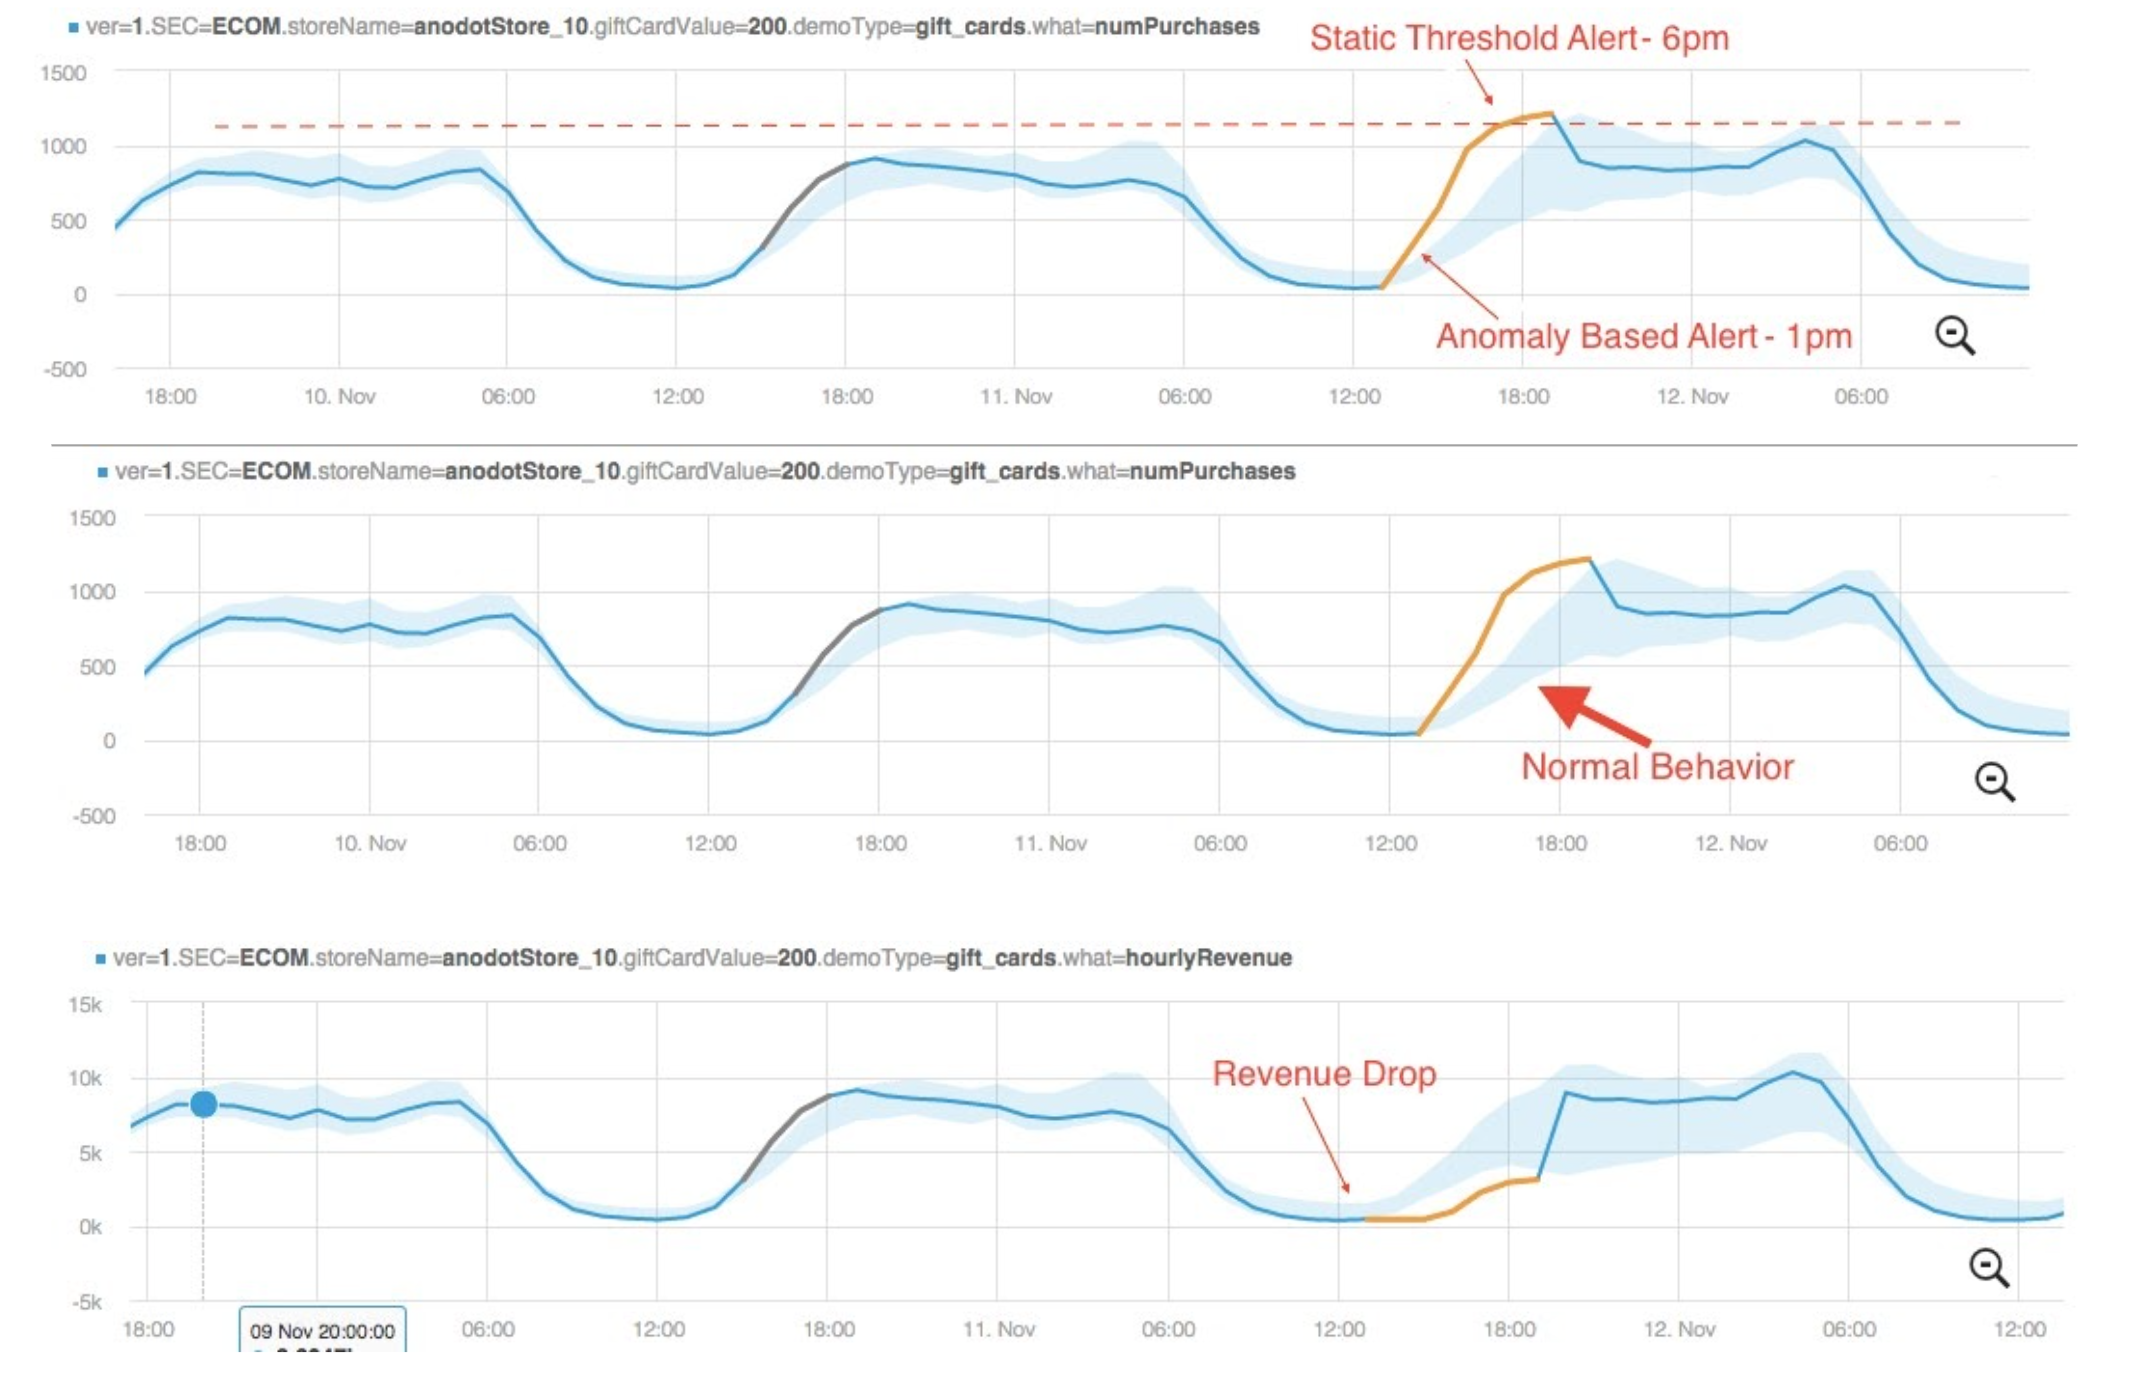
Be smart also on the evaluation with standard deviation and percentile ... mean is usually dropping the relevant value to evaluate performances under stress