Docker-latency
aka the network blaming tool
So again another grafana stack with docker
Well yes but with a precise scope
In this period we are almost all working from home,
the blaming topic is usually the connection with our offices or the datacenters.
Is not so rare for a network Administrator hear people that sais ,
the vpn is slow , i cannot connect to ... $something , bla bla bla
In my experience this is usually due to the quality of the provider,
sometimes is also a problem on route path on T2/T3 providers
HOW we can undestand if our network is really slow ?
The idea is to start a grafana stack ready-made to handle the basics statistics of our internet connection.
We need to choose some endpoints to monitor, example , your vpn endpoint , your datacenter/office public ip , the main dns servers and so on
Requirements
- Docker
- Docker Compose
Stack
- Influxdb
- Grafana
- Telegraf
Tree
├── .env
├── Makefile
├── README.md
├── docker
│   ├── grafana
│   │   ├── Dashboard-PING.json
│   │   ├── dashboard.yaml
│   │   └── datasource.yaml
│   ├── influxdb
│   │   ├── influxdb.conf
│   │
│   └── telegraf
│       └── telegraf.conf
├── docker-compose.yml
Makefile is ... well a makefile , commands allowed
up , down, dev, down, logs, clean
up is to startup the stack
down to shutdown clean is done to remove also the storage saved for influxdb and grafana
.env contains the grafana and influxdb credentials (yes the default password is quite complicated)
Since this tool is hosted in your laptop (could be everywhere), never mind the security
GRAFANA_USER=admin
GRAFANA_PASSWORD=EQyFJpjxvJG8k2K8
INFLUXDB_DOMAIN=influxdb
INFLUXDB_DATABASE=ping
Configuration
We just need to choose the endpoints we'd like to monitor from our internet connection This could be done editing telegraf.conf
[global_tags]
[agent]
  interval = "10s"
  round_interval = true
  metric_batch_size = 1000
  metric_buffer_limit = 10000
  collection_jitter = "0s"
  flush_interval = "10s"
  flush_jitter = "0s"
  precision = ""
  hostname = "local-telegraf"
  omit_hostname = false
[[outputs.influxdb]]
   urls = ["http://127.0.0.1:8086"]
   database = "ping"
[[inputs.ping]]
urls = ["1.1.1.1", "8.8.8.8", "208.67.222.222", "test1.velocable.com"]
count = 7
ping_interval = 1.0
Edit urls = adding / modify the endpoints
(in this example, Cloudflare dns , Google dns, opendns, and a server in Madrid used for speedtest)
The configuration is collecting information every 10 seconds , and run a ping command 7 time each with 1 second delay.
Startup
Inside the main folder run
make up
output:
docker-latency$ make up
docker-compose -f docker-compose.yml up -d
Creating network "docker-latency_default" with the default driver
Creating grafana  ... done
Creating influxdb ... done
Creating telegraf ... done
login to:http://localhost:3000/ admin/EQyFJpjxvJG8k2K8
you will see
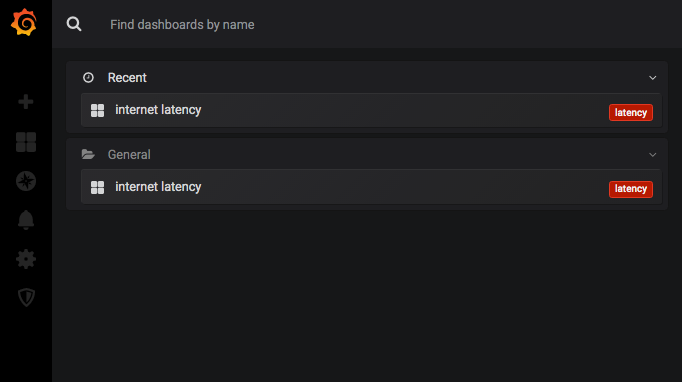
than , checking for the only board present --> internet latency
you will have all details about the endpoint chosen , packet loss especially
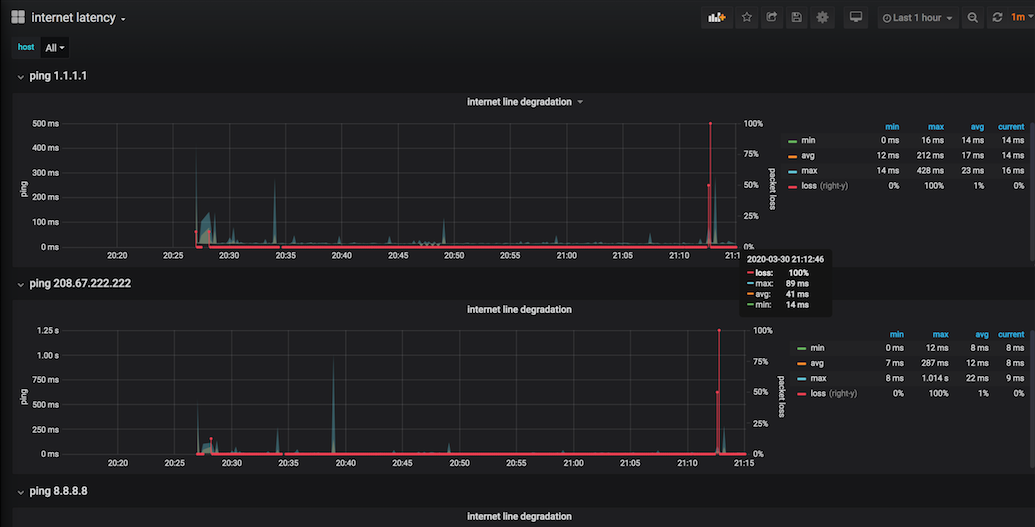
100% packet loss simulated disabling network card for few seconds.
The dashboard is using variables in order to create 1 row for each endpoint.
Conclusion
Now we have data, so we know what is going on in our internet connection and we can probably
have more details about the infomagic words like ... is slow