The Safe Zone: Where AI Actually Belongs in Business Processes
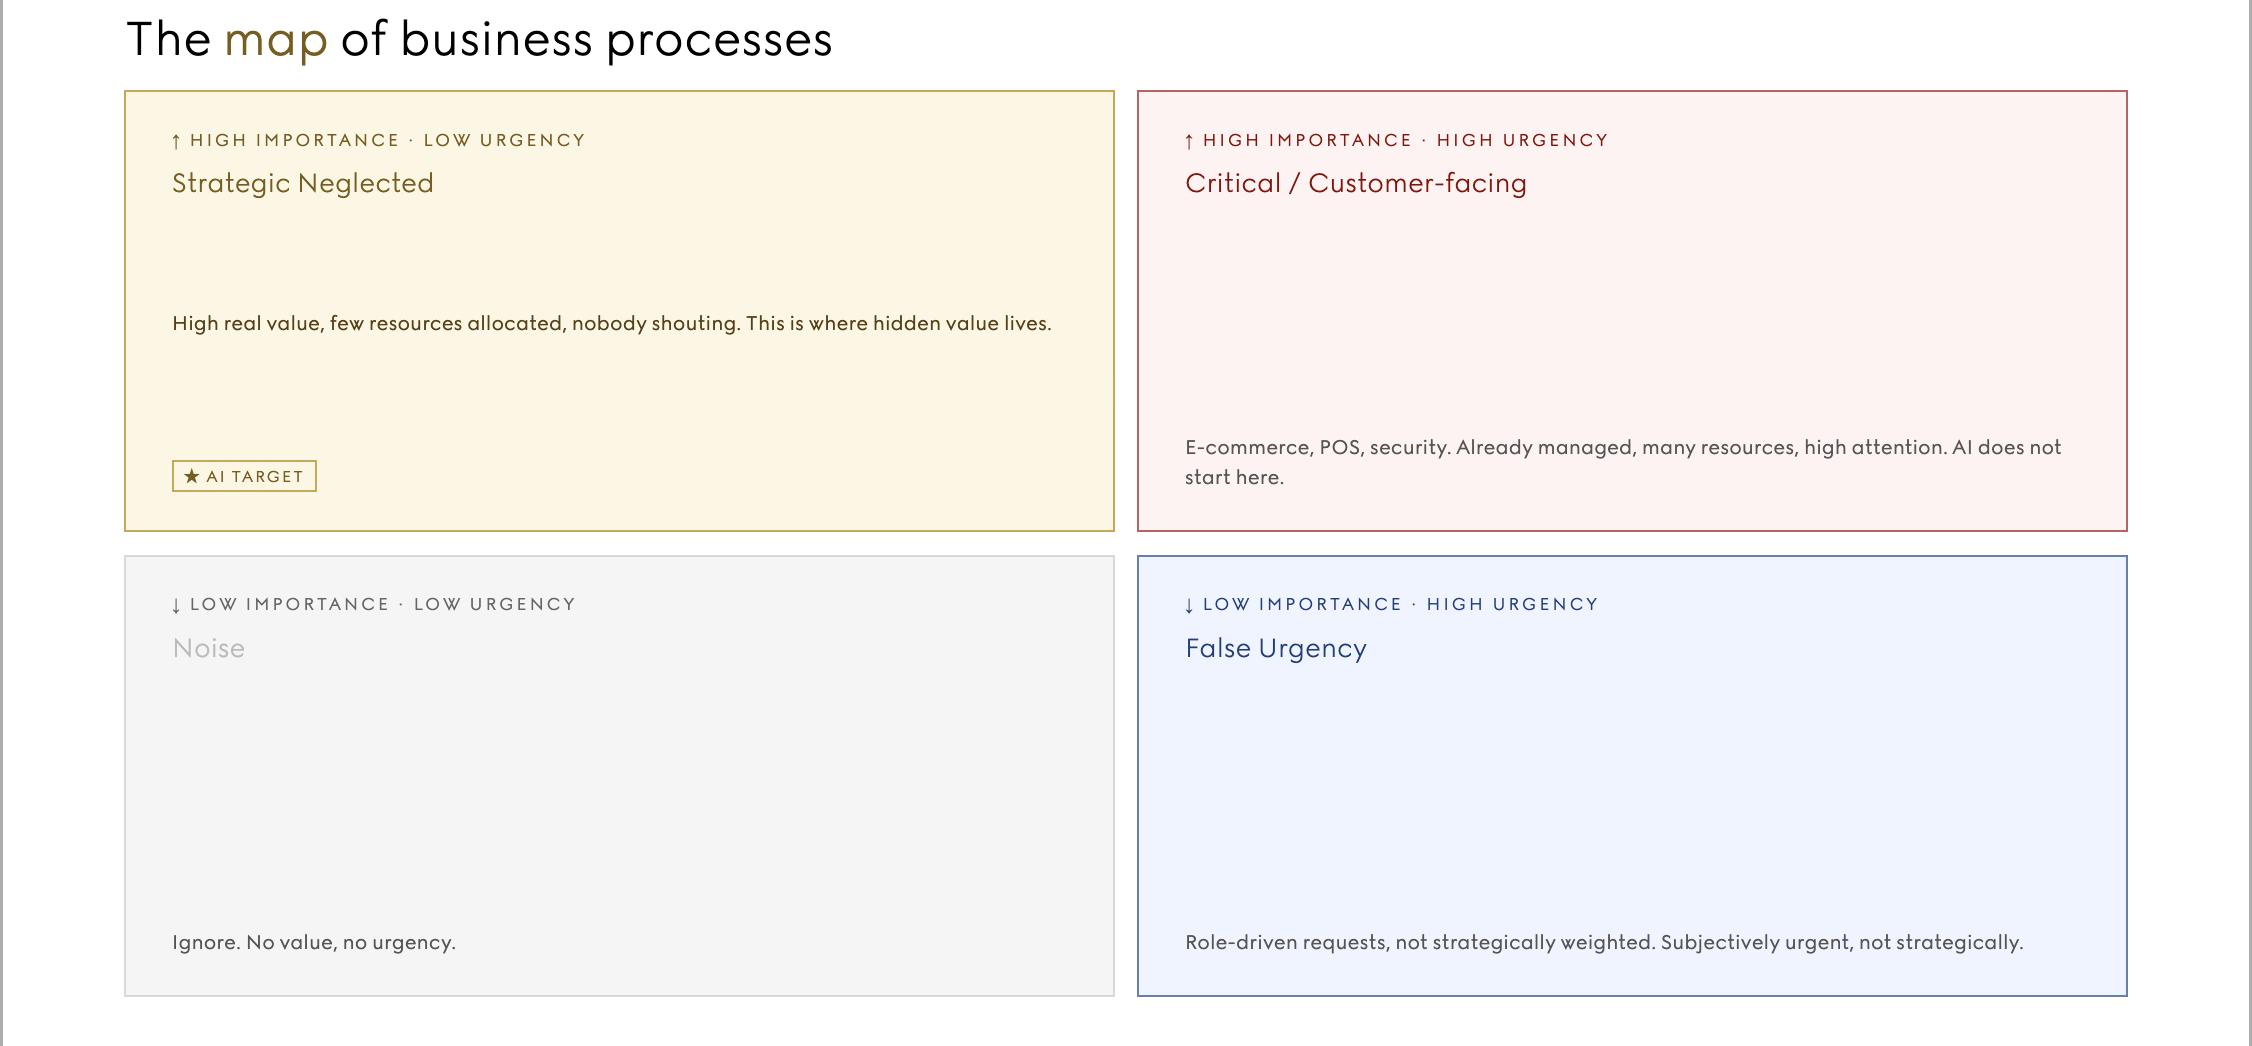
Table of Contents
- Introduction
- The Problem With Urgency
- The Safe Zone Framework
- The Case: Algolia Usage Exporter
- Before / After
- How It’s Built
- The Skill Framework: Three Skills, Not One Prompt
- From API Schema to Natural-Language Contract
- What It Exposes
- Numbers That Weren’t Visible Before
- Why the Pattern Replicates
- The Honest Challenges
- AI Amplifies Whatever Maturity Already Exists
- Tech Debt Doesn’t Disappear
- Creating Is Easy. Deploying on Shared Platform Isn’t
- Ownership Is Still Informal
- The Escalation Risk: Safe Today, Critical Tomorrow
- A Maturity Model, Not a Tech Roadmap
- Security Considerations
- Conclusion
- Reflections
Here we are. I recently put together an internal presentation on introducing AI into business processes, and the hardest part wasn’t the technology. It was convincing people to look in the opposite direction of where they instinctively point AI.
Every pitch I’d seen before started with the loudest process in the room: the customer-facing platform, the checkout flow, the thing that pages someone at 3am. Strange, applying AI there first? Those are exactly the processes that already get every scrap of attention, budget, and engineering hour a company has. AI doesn’t fill a gap there, it just adds risk to something already well covered.
The real gap is somewhere else entirely: high-value work that nobody owns because it doesn’t shout. In this article I’ll walk through the framework I used to make that argument, and the case study that made it concrete, a Prometheus exporter for Algolia usage data that took four hours to build and replaced a 4-hour-a-month manual ritual, permanently.
The Problem With Urgency
Companies allocate attention by urgency, not importance. That sounds obvious once you say it, but it explains almost everything about where automation effort actually goes.
Plot any business process on two axes: how urgent it feels, and how important it actually is. Four quadrants fall out:
| Quadrant | Urgency | Importance | What happens to it |
|---|---|---|---|
| Customer-facing critical | High | High | Gets everything: budget, headcount, on-call rotations |
| False urgency | High | Low | Gets attention it doesn’t deserve, mostly noise |
| Background noise | Low | Low | Correctly ignored |
| Strategic neglected | Low | High | Nobody owns it. Nobody has time. This is the target. |
That last quadrant is where AI actually has room to move. Nobody is fighting AI for the attention budget there, because nobody was spending attention on it in the first place. A monthly usage report that takes four hours to assemble by hand isn’t urgent. It won’t page anyone if it’s late. But it feeds a contract renewal decision worth real money, and it has been quietly under-resourced for years because it never screamed loud enough to earn a fix.
Same map, plotted instead of tabulated, with a handful of real processes dropped onto it:
Top-left is empty on most companies’ actual roadmaps, not because it’s hard to fill, but because nothing in the top-left ever forces its own way onto anyone’s calendar. Everything in the top-right and bottom-right gets a Jira ticket by itself. Nothing in the top-left does, until someone deliberately goes looking for it.
The Safe Zone Framework
Before pointing AI at anything, I ask two questions:
- If it fails, does the customer notice?
- Is there a manual fallback?
If the answer is no to the first and yes to the second, you’re in the safe zone. Start there.
The safe zone has three properties by definition: it’s not customer-facing, it has a manual fallback available, and it’s typically read-only. Compare what a failure actually looks like on both sides of that line.
Zona critica: AI on an e-commerce platform. A pricing model produces a silent bug, wrong prices go live for hours, revenue is lost immediately and irreversibly, and by the time someone notices, orders are already in the pipeline and communications have gone out. Rollback doesn’t undo any of that. Recovery is measured in days, and there usually isn’t a fallback you can flip to in the meantime.
Zona sicura: AI on a usage exporter. A pod crashes. Datadog stops receiving metrics. Nobody’s search results changed, because the exporter never touches the search index, it’s read-only against a monitoring API. The team that needs the data falls back to the vendor’s own dashboard, exactly as they did before the exporter existed. A pod restart brings it back in minutes, and no data is lost because the source API retains history.
Same failure mode, wildly different blast radius. That difference is the whole argument for where to start.
The Case: Algolia Usage Exporter
The clearest candidate I found sitting in the neglected quadrant was Algolia usage reporting. Every month, a manager logged into the Algolia portal, took screenshots of graphs that don’t export cleanly, pulled a partial CSV, and cross-referenced it in Excel against other systems to forecast next month’s consumption for a contract renewal decision.
Before / After
| Before | After | |
|---|---|---|
| Process | Manual, monthly, ~4h | Automatic, continuous, 0h |
| Quality | Variable, depends on who does it | Constant, real-time |
| Fallback | — | Algolia portal, always available |
| Risk | Wrong forecast → wrong contract plan | Zero impact on the e-commerce search itself |
| Build time | — | 4 hours, AI-assisted |
| ROI break-even | — | First month |
Four hours to build something that eliminates four hours a month of manual work, forever. Over two years that’s roughly 96 hours saved for a one-time four-hour investment, a 24x return, and that’s before counting the cost of decisions made on stale or partial data.
How It’s Built
The exporter is a stateless, read-only Prometheus exporter that pulls from Algolia’s Usage API and Monitoring API on a background thread, caches results in memory, and serves them on /metrics without ever calling Algolia synchronously during a scrape.
Decoupling the background refresh from the scrape endpoint matters more than it looks. /metrics never calls Algolia, it only reads from the cache, so a slow or rate-limited upstream API can’t turn into a Prometheus scrape timeout.
It was built with three AI skills in sequence, each handling one concern:
The Skill Framework: Three Skills, Not One Prompt
A “skill” here isn’t a clever one-liner prompt, it’s a written, reusable set of instructions that encodes a specific kind of decision-making, handed to the model as its own bounded task. Splitting the work into three of them instead of asking for “an Algolia exporter” in one shot is the actual design decision that made this replicable, so it’s worth unpacking each one.
Skill 1, Metric Design, never touches code. Its only input is the target API’s documentation, in this case Algolia’s Usage API and Monitoring API references. Its output is a specification: which endpoints map to which Prometheus metric type (all Gauges here, since Algolia returns snapshots, not cumulative counters), what labels each metric carries, where cardinality could blow up (the 48h hourly window times 29 stats times N indexes was flagged at this stage, before a line of Python existed), and what naming convention to follow so metric names still make sense once Datadog rewrites underscores to dots. Getting this wrong is a design mistake. Getting it wrong after the collectors are already written is a rewrite.
Skill 2, the Python Exporter, consumes that spec and produces working code. This is where the background-refresh-thread-plus-cache architecture actually gets decided and built: a daemon thread calls the Algolia client on an interval, updates a thread-safe MetricsCache under a lock, and the /metrics, /health, /ready endpoints only ever read from that cache, never from the network. This skill also owns the retry policy, three retries with backoff, scoped to GET/HEAD/OPTIONS only, retrying on 429/500/502/503/504, treating a 403 on infrastructure metrics as an expected plan-tier skip rather than an error, and raising immediately on any other 4xx because that means a bad key, not a transient failure. It also scaffolds the test pyramid, unit tests with mocked HTTP, integration tests against the cache’s update/generate cycle, and e2e smoke tests asserting the /metrics output is valid Prometheus text.
Skill 3, Deploy, takes the built exporter and makes it runnable on shared infrastructure. It generates the Helm chart, sizes resource requests and limits for what is admittedly a lightweight process (50m/200m CPU, 64Mi/128Mi memory), sets runAsUser: 1000 and readOnlyRootFilesystem: true, wires liveness and readiness probes to the app’s own /health and /ready semantics rather than generic defaults, points secrets at a Kubernetes Secret via secretKeyRef instead of values.yaml, configures Datadog pod-annotation autodiscovery so no ServiceMonitor is needed, and generates the dashboard JSON using the exact metric names Skill 1 decided on three steps earlier.
Three narrow skills chained together instead of one broad prompt buys two things. First, each skill’s output becomes an explicit, inspectable contract for the next one, closer to a design review followed by a code review followed by a deploy review than to a single undifferentiated generation step, just compressed into hours instead of weeks. Second, and this connects directly to the maturity problem covered later: a skill is only as good as the standard baked into it. Skill 1 encodes naming and cardinality conventions. Skill 3 encodes the security posture (non-root, no secrets in chart values, probes tied to real readiness). If nobody had written those standards into the skills beforehand, the model would still produce something that runs, it would just be something that runs while quietly violating conventions nobody told it about.
It’s also why the pattern replicates so cheaply across SaaS targets. Skill 1 is the only one that actually changes shape per vendor, since every API has its own quirks to read and map. Skills 2 and 3 are close to identical every time, because the exporter shape (background thread, cache, three endpoints) and the deployment shape (Helm chart, K8s Secret, Datadog autodiscovery) don’t depend on whether the upstream is Algolia, Contentful, or Akamai. That’s the real reason Contentful landed at 4-6 hours right behind Algolia’s 4, not a coincidence.
From API Schema to Natural-Language Contract
There’s a bigger shift hiding inside Skill 1 that’s worth naming on its own, because it changes what “the contract” between your code and a vendor’s API actually is.
The traditional way to integrate with a third-party API is to pull an OpenAPI or Swagger spec, run it through a codegen tool, and get a typed client out the other end. The contract is enforced by the compiler: if the vendor changes a field type or a required parameter, your build breaks in CI before it ever reaches production. That’s the entire value of a formal schema, it turns “did the API change under us” into a machine-checkable question.
Most usage and monitoring endpoints never come with one. Algolia’s Usage API and Monitoring API are documented the way most SaaS vendors document this class of endpoint: prose descriptions, a handful of curl examples, a paragraph explaining wildcard fallback behavior, a note three headings down clarifying that a 403 means your plan doesn’t include Monitoring rather than that something’s broken. There’s no spec file to diff. There’s no generated client that fails to compile when something drifts.
That’s the gap Skill 1 actually fills, and it’s the shift worth calling out directly: the contract moved from a machine-readable schema to a natural-language instruction set. The skill reads the same prose a human integrator would read, and does the job a formal spec used to do: deciding types, labels, cardinality, error semantics. Except now the artifact holding those decisions is a written skill definition, not a .yaml or .json schema.
This is exactly why the pattern stays uniform across vendors whose documentation looks nothing alike, Algolia, Contentful, Commerce Layer, Akamai. The skill doesn’t need a shared schema format to normalize against, it needs to read prose and land on the same shape of decision every time: what’s a Gauge versus a Counter, what belongs in a label versus a metric name, what error code means “expected, skip it” versus “misconfigured, fail loudly.”
But a natural-language contract doesn’t fail the way a schema does. A broken OpenAPI diff shows up as a compile error, loudly, before deploy. A vendor quietly rewording a paragraph about rate limits, or redefining what a 403 means, breaks nothing at build time. It just means the skill would decide differently if it were run again today, and nothing forces that rerun. This is precisely the exporter’s own stated known gap: no integration test against a real, non-mocked API response, so a schema change upstream sails through unit tests and fails silently in production until a dashboard goes quietly empty.
The contract now lives in prose on both ends: the vendor’s documentation, and the skill’s instructions for reading it. Nothing keeps those two in sync automatically, the way a schema validator would. Which means maintaining one of these exporters isn’t just patching a CVE in requests every quarter, it’s periodically re-checking that the skill’s reading of the vendor’s docs still matches what the vendor’s docs currently say, a review step with no compiler around to fail loudly if it gets skipped.
Configuration is entirely environment variables, and required ones raise a ValueError at startup, so a misconfigured pod crash-loops visibly instead of running silently with half its metrics missing:
ALGOLIA_APPLICATION_ID=your-app-id            # required
ALGOLIA_USAGE_API_KEY=your-usage-key          # required, dedicated read-only key
ALGOLIA_MONITORING_API_KEY=your-monitoring-key  # optional, Premium/Elevate plan
ALGOLIA_INDEX_NAMES=products,collections      # optional, comma-separated
USAGE_GRANULARITY=hourly                      # hourly (48h window) or daily
REFRESH_INTERVAL_MINUTES=5                    # avoid going below 5
EXPORTER_PORT=8000
Deployed on Kubernetes with modest resource requests, since there’s nothing compute-heavy happening:
resources:
  requests:
    cpu: 50m
    memory: 64Mi
  limits:
    cpu: 200m
    memory: 128Mi
Datadog picks up the exporter with pod-annotation autodiscovery, no ServiceMonitor needed:
podAnnotations:
  ad.datadoghq.com/algolia-exporter.checks: |
    {
      "openmetrics": {
        "instances": [{
          "openmetrics_endpoint": "http://%%host%%:8000/metrics",
          "namespace": "algolia",
          "metrics": ["algolia_.*"]
        }]
      }
    }
What It Exposes
All metrics are Gauges, because Algolia’s Usage API returns snapshots rather than cumulative counters:
| Metric | Type | Labels | Purpose |
|---|---|---|---|
algolia_usage_total | Gauge | app_id, statistic | Latest value per stat, primary dashboard metric |
algolia_usage_hourly | Gauge | app_id, statistic, timestamp | 48h rolling window, high cardinality |
algolia_usage_daily | Gauge | app_id, statistic, date | Daily points, low cardinality, good for forecasting |
algolia_usage_by_index | Gauge | app_id, index_name, statistic | Per-index breakdown |
algolia_infra_metric | Gauge | app_id, metric, server | CPU/RAM/SSD, Premium plan only |
algolia_exporter_last_refresh_success | Gauge (0/1) | — | Primary SLI for the exporter itself |
Datadog rewrites Prometheus names on ingest (underscores become dots, namespace prepended), so algolia_usage_total becomes algolia.usage.total in every dashboard query and alert.
Numbers That Weren’t Visible Before
This is what showed up in Datadog the day the exporter went live, none of it was queryable before:
- 112k search operations/day, 102k search requests/day
- 737k total write operations, 852k total operations
- 2M records indexed across 12 GB of data
- 5ms average query processing time, 75ms P99, 20ms P90
- 386 max QPS registered
None of that data was new. Algolia always had it. The exporter didn’t create value, it made value that already existed accessible instead of trapped behind a portal.
Why the Pattern Replicates
The three-skill pipeline (design, build, deploy) is generic to any SaaS with a REST usage endpoint. I already run the same shape of exporter against Contentful, full write-up here, and the estimated effort for the next candidates is similarly small:
| SaaS | Status | Estimated effort |
|---|---|---|
| Algolia | Done | 4h |
| Contentful | Done | 4-6h |
| Commerce Layer | Candidate | 3-5h |
| Akeneo | Candidate | 4-6h |
| Akamai | Candidate | 3-5h |
| Any REST-API SaaS | — | Same framework |
The marginal cost of the second exporter is small, and the third is smaller still, because the design and build skills already encode the pattern.
The Honest Challenges
None of this means “just point AI at the neglected quadrant and walk away.” Five real problems showed up, and pretending they don’t exist would make this a worse post.
AI Amplifies Whatever Maturity Already Exists
If a team has solid standards for naming, structure, security, and testing, AI extends them. If those standards aren’t codified anywhere, AI produces artifacts that look correct but silently diverge, and nobody notices until the debt is already large. The prerequisite is boring but real: define and document the standards you want respected before using AI to build against them. Skills are a good enforcement mechanism, but only if someone who actually knows the standard writes them.
Tech Debt Doesn’t Disappear
A tool built with AI is still real code with real dependencies and real CVEs. Speed of creation doesn’t reduce the cost of maintaining it over time, and every new artifact is a full SDLC commitment: patching, upgrades, deprecation. The specific risk is a proliferation of orphan tools, created quickly, never updated, quietly becoming unmonitored attack surface. In the exporter’s own known-limitations list: no Dependabot/Renovate, no blocking CVE pipeline in CI, no SBOM. All still open items on a tool that’s already in production.
Creating Is Easy. Deploying on Shared Platform Isn’t
AI generates code, a Dockerfile, and a Helm chart in hours. Getting that artifact into the standard GitOps cycle, CI/CD pipeline, registry, namespace, secrets, approval workflow, requires platform knowledge and access that not everyone has. That gap between “created” and “correctly in production” is where friction actually lives:
| Stage | Speed | AI’s contribution |
|---|---|---|
| Idea + AI skill | Hours | Accelerates a lot |
| Code + Dockerfile | Hours | Accelerates a lot |
| Local test | Hours | Accelerates a lot |
| Code review | Days | Partial |
| CI/CD pipeline | Depends | Doesn’t solve it |
| Registry + K8s namespace | Access-gated | Doesn’t solve it |
| Secrets + GitOps | Process-gated | Doesn’t solve it |
| Monitoring + alerting | Setup | Partial |
| Ownership / SDLC | TBD | Doesn’t solve it |
The green part of that table is where AI genuinely earns its keep. The red part is platform engineering and governance, and it doesn’t get faster because a model wrote the Dockerfile. Skip it, and every team doing AI-driven development turns into a support ticket for an infra team that wasn’t sized for the volume.
Ownership Is Still Informal
The ideal model is that whoever builds a tool owns it for its whole lifecycle, monitoring, patching, incident response, deprecation. In practice, that’s not formalized anywhere yet. Today, ownership is implicit: whoever built it knows it best, but has no formal mandate, and if they change teams or leave, the tool goes orphan. Monitoring existing (Datadog, in this case) is necessary but not sufficient, an alert with no responsible owner is just noise.
The Escalation Risk: Safe Today, Critical Tomorrow
The safe zone isn’t a permanent label, it’s a snapshot. Here’s how a tool quietly crosses the line from “nice to have” to “load-bearing”:
- Day 1: Tool built as optional support for forecasting. Manual fallback exists.
- Month 3: A manager starts including the exporter’s Datadog data in the contract report. The process adapts to the tool.
- Month 6: Nobody practices the manual fallback anymore. Nobody quite remembers how it worked. The tool is de facto mandatory.
- Day X: The tool is down. The contract renewal is tomorrow. There’s no BC/DR plan, no SLA, no reachable owner.
Delegating that coverage to an external support vendor doesn’t fix it, it just relocates the problem to someone who doesn’t know the business calendar and can’t guarantee an SLA tied to a contract renewal date. Governance needs to happen before a tool crosses that threshold, not after an incident makes it obvious it already did.
A Maturity Model, Not a Tech Roadmap
None of this is a technical roadmap. It’s an organizational one, moving from informal individual use to a shared, governed model.
| Level | State | Characteristics |
|---|---|---|
| L1 (now) | Individual, informal | Personal use, undeclared, no review, no codified standards |
| L2 (Q3 2026) | Structured pilot | Safe-zone criteria defined, reusable skills, mandatory review, declared ownership |
| L3 (Q4 2026) | Shared governance | SDLC baseline, active CVE pipeline, minimum QA pyramid, artifact registry |
| L4 (2027) | Self-service platform | Self-service K8s onboarding, automated GitOps, BC/DR for critical tools |
The biggest jump isn’t L1 to L4, it’s L1 to L2. That’s the point where informal AI use stops and the rules of the game get declared. Everything else builds on that one decision. Concretely, moving from where we are today to L2 means the creation process stops being “anyone builds anything without telling anyone” and becomes codified skills plus a mandatory review; ownership stops being implicit and becomes a name, a team, and stated SDLC responsibilities in a registry; and visibility stops being zero and becomes an actual list of what AI-built tools exist in production, who owns them, and when they were last touched.
Security Considerations
- Read-only by construction. The exporter only issues GET requests against Algolia’s APIs, using a dedicated API key scoped to the Usage ACL. It cannot modify, delete, or write anything.
- Fail-loud configuration. Missing required environment variables raise immediately at startup, the pod crash-loops visibly rather than running with silently missing metrics.
- Retry policy is scoped correctly.
urllib3.Retrywith 3 retries and backoff only applies to GET/HEAD/OPTIONS, retrying on 429/500/502/503/504. A 403 on infrastructure metrics (plan doesn’t include Monitoring) is treated as an expected skip, not an error; other 4xx codes raise immediately since they mean misconfiguration. - Secrets stay in Kubernetes Secrets, never in
values.yaml, mounted viasecretKeyRef. - Known gap, stated plainly: there’s no integration test against a real (non-mocked) Algolia API response. If the schema changes upstream, it would pass unit tests and fail silently in production until a dashboard goes quietly empty.
Conclusion
The safe zone framework isn’t really about AI, it’s about admitting that companies chase urgency, not importance, and that the gap between the two is where the highest uncaptured value sits. Four hours of AI-assisted work turned a 4-hour monthly manual ritual with variable quality into continuous, real-time, queryable data, with break-even in the first month and zero blast radius if it fails. That’s the pitch. What follows it (tech debt, ownership, platform friction, the slow drift from optional to critical) is the part that actually determines whether this scales past one case study or stays a nice demo.
Reflections
What is still missing? Mostly organizational answers, not technical ones. Who is accountable if AI produces a wrong number that ends up in a business decision? How do you keep an exporter aligned when the upstream SaaS API changes its schema without warning? How do you actually measure the value recovered from the neglected quadrant, rather than just asserting it? Which processes should never be automated, even if they’d technically qualify as safe zone? And who signs off on the residual risk once a tool has quietly become load-bearing?
None of those have a clean answer yet. The maturity model above is an attempt to get to a point where an organization has actually decided, rather than drifted, but L1 to L2 is still ahead of us as of this writing. If you’re evaluating where to point AI in your own org, the two-question filter (does the customer notice if it fails, is there a manual fallback) is a cheap way to find your own neglected quadrant before you build anything.